Categories
Lab News

Mapping Museums Database: New Developments

Since our blog entry on building the database, we have held a series of user trials of the Mapping Museums database and the Web Application through which the database is accessed. These trials have given us much useful feedback for improving the system as well as a positive endorsement of the overall development approach. For example, museums experts told us that the system is “useful to anyone wanting to understand the museum sector as this is the closest we’ve ever been to getting a full picture of it”, “intuitive to use”, “the Museum equivalent of YouTube”.

Following the user trials, we have made some improvements and extensions to the user interface, have incorporated data relating to some 50 additional museums, and have added three new attributes for all of the 4000+ museums in our database. The new attributes relate to the location of each museum and are Geodemographic Group and Geodemographic Subgroup and Deprivation indices (English indices of deprivation 2015, Welsh Index of Multiple Deprivation, and Northern Ireland Multiple Deprivation Measure 2017).

The figure on the left shows the architecture of our system. It has a three-tier architecture comprising a Web Browser-based client served by a Web Server connecting to a Database Server.  The database is implemented as a triple store, using Virtuoso, and it supports a SPARQL endpoint for communicating with the Web Server. The system currently comprises some 28,600 lines of Python code, as well as additional scripts consisting of 25,800 lines of JavaScript, HTML pages, and other source files.

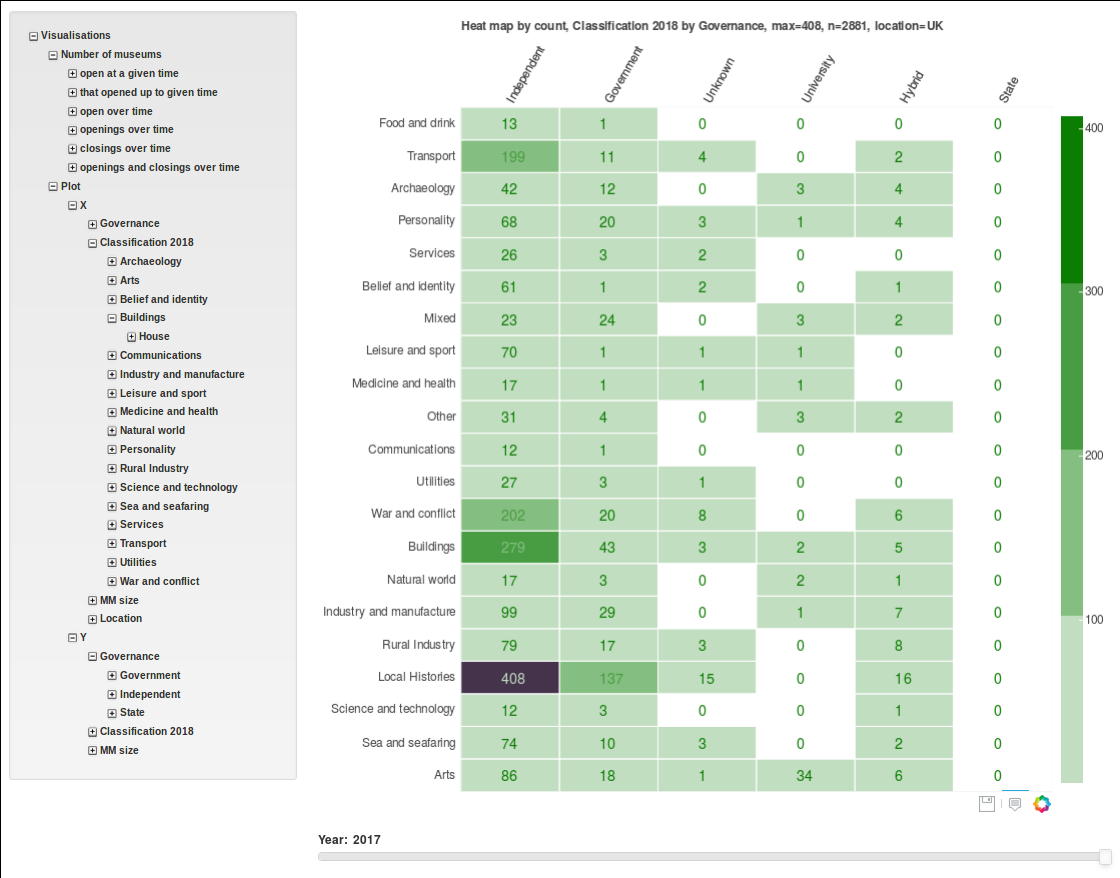
Usage of the database and Web Application by the project’s researchers has already led to insights about periods and regions that show high numbers of museum openings or closings, changes in museums’ accreditation and governance status over the past 60 years, and popular subject areas. There will be two more years of detailed research, both qualitative and quantitative, building on this first phase of research.

The qualitative research is comprising both archival and interview-based work. The quantitative research is investigating correlations between high rates of openings or closings of museums and attributes such as accreditation, governance, location, size, and subject matter. The new attributes Geodemographic Group/Subgroup and Deprivation Index are enabling new analyses into the demographic context of museums’ openings/closing, including cross-correlation of these aspects with the other museum attributes, and hence the charting of new geographies of museums.

Ongoing development work is extending the Web Application into a full Website to showcase the outcomes and findings of the project.  We are also developing a new web service to allow the capture of data updates relating to existing museums and the insertion of data about new museums. There will be forms allowing the public upload of such data which will be subsequently validated by the project’s domain experts before being inserted into the database.

© Alexandra Poulovassilis, Nick Larsson, Val Katerinchuk

Categories
Lab News

Two Years On: An Update

The Mapping Museums project is coming to the end of its second year. To mark the half way point of the research, this blog provides a brief update on some of the work so far.

Finalising the data
Early this year, Dr Jamie Larkin, the researcher, completed the main phase of data collection. We are continuing to make changes to the dataset as new museums open and existing museums close, and we’re still trying to hunt down some missing opening and closing dates, so it remains work in progress. Nonetheless, we now have information on almost 4,000 museums that have been open at some point between 1960 and the present day.

Evaluating the knowledge base

Alongside data gathering, we have designed a knowledge base that allows users to browse, search, and visualise the data in nuanced and precise ways, and which we described in our last blog (See: Managing Patchy Data). As part of the design process, Professor Alex Poulovassilis, the co-investigator on the project, and Nick Larsson, the Computer Science researcher and developer of the knowledge base, organised a series of trials to evaluate the knowledge base. These provided us with valuable feedback and we responded by making changes to how the material is presented and navigated.

We got enormously positive responses at the most recent user trial in Manchester in July. Having lived and breathed the research for the last two years it was very encouraging to hear Emma Chaplin, director of the Association for Independent Museums, call it the “museums equivalent to YouTube” and say that she could while away hours browsing the material; to know that staff from Arts Council England thought that it was “intuitive  to use”; and generally that the trial participants assessed it as a being a useful resource for them in their roles and for others in the sector.

Analysing and publishing the findings

Having finished the data collection and the main phase of developing the knowledge base, we have been able to start analysing the data. These initial analyses will be the basis of a series of articles, and over the summer, the team has been working on four publications:

  • ‘Mapping Museums and managing patchy data’ examines the reasons why data on the museum sector is so incoherent, how the project sought to remedy that situation, in part by building a system that acknowledges uncertain information.
  • ‘Where was the Museum Boom?’ looks at the massive expansion of museums in the late twentieth century and asks whether or not the boom took place across the UK, or if there were regional variations.
  • ‘Creating a Knowledge Base to research the history of UK independent museums: a Rapid Prototyping approach’, covers the computer science research that underpins the conceptualisation and construction of the knowledge base.
  • ‘Missing Museums’ deals with the recent history of museum surveys, considers the focus on professionalised museums, and asks what the sector looks like when we factor in unaccredited museums.

Brief versions of the first and second of these papers were also presented at conferences: Digital Humanities Congress at Sheffield University and Spatial Humanities at Lancaster University, both of which took place in September, and we hope that the full versions of all four articles will be published within the next academic year. We’ll let you know when that happens.

The process of analysing data has been greatly helped by having Dr Andrea Ballatore join the team early in 2018. Andrea is a Lecturer in GIS and Big Data Analytics in the Department of Geography at Birkbeck and he is leading the statistical analysis within the project. He has also made invaluable contribution to developing the knowledge base, particularly with respect to mapping the data.

The Mapping Museums Team