We’re delighted to announce that key functions from the original Mapping Museums Lab database have now been fully integrated into our new web application.
We are very grateful to Art Fund for helping fund additional development work, which has enabled us to extend and strengthen the Mapping Museums Lab resource for the benefit of the wider museums and heritage community.
This update brings together, in one place, the rich data from our first major project — a comprehensive database of all museums open in the UK from 1960 to the present — with our second major strand of research: detailed information on museums that have closed, including reasons for closure and the outcomes for their collections. For the first time, users can seamlessly explore all the Mapping Museums Lab data in one site.
Responding to input from our sector evaluation sessions, the addition to the web application offers a more flexible and intuitive user experience. You can now:
Search for individual museums using free text
View detailed information for each museum
Generate and search across lists of all museums in the database
We’ve also refreshed and expanded our accreditation data. Records have been updated and accreditation numbers added, making it easier to track institutional status and align our data with other resources and sector standards.
Whether you’re a researcher, policymaker, sector professional, or independent scholar, the new platform is designed to make the data more discoverable, usable, and interconnected than ever before. We look forward to seeing how you use it.
The original Mapping Museums database will no longer be updated.
Do you use the Mapping Museums database? If so, we need your input.
Bad News: The Mapping Museums Database is now almost six years old, which is elderly for prototype software. Redeveloping a database is expensive and our funding has come to an end. Thus, we have made the decision to archive the original Mapping Museums project website and database. It will still be available online, but the data will not be updated and the system will not be supported after December 2025.
Good News: We developed a new web application as part of our most recent research on museum closure and collections disposal. This application allows users to search and visualise the new data.
The new web application will also offer a slimmed down version of the Mapping Museums Database, and the information will continue to be updated.
We will not be able to transfer the complete the Mapping Museums Database to the new web app, so we need to know what functions are essential for you.
Please can you tell us how you use the Database?
For example:
Do you use Browse or Search to look for museums?
Do you use the quick search or the advanced search?
What information do you look for? museums’ postcodes? governance? size?
Do you use the information on social deprivation or the geo-demographic areas?
Do you ever look at notes?
Do you use the Visualise functions, if so, which ones?
What can you not easily do without?
Any information on how you use the Database and what you would like to retain will help us ensure continuity of service. We appreciate you taking the time to respond. Please send any feedback to mappingmuseums@bbk.ac.uk
Can you help us to evaluate the new Mapping Museums Lab web application? Would you like a preview of the new Mapping Museums data on museums closure and collection disposal? Can you be in London on Monday 29th September 2025 from 2-4.30pm?
The Mapping Museums Lab is a multidisciplinary team based at Birkbeck, University of London and King’s College London. For our current project ‘Museum closure in the UK 2000-25’ we have collected data on which museums have closed, why, and what has happened to those collections. We’ve also developed software to help us analyse and visualise that information.
The evaluation session is an important means for us to gain feedback about the usefulness of the software. With your input we can further improve the system before it is made publicly available in November.
We’re particularly keen to have input from people working in museums, museum support organisations, and museum policy.
The trial session will be based on three activities:
A hands-on introduction to the web application.
Using the application to undertake a small number of information searches. This will allow us to gauge how easy the system is to use.
Group discussion about your experience of using the system and the ways that it could be improved and extended.
If you are able to join us for the afternoon or if you need any further information please contact Katy Pettit on k.pettit@bbk.ac.ukletting her know your job title / role and / or interest in the topic. We look forward to seeing you.
We are currently developing visualisations of our data on the whereabouts of collections from closed museums. This is proving complex because graphs, figures, or flow diagrams are never just a simple representation of information. And that problem is compounded when the data itself is patchy and sometimes imprecise. In this post we want to discuss some of the choices we made about modelling that information.
To recap, around 525 museums in the UK have closed since 2000 and we have been investigating what happened to their collections. That information has been entered onto a spreadsheet with almost two thousand lines of information. It is nearly impossible to get a grasp on the data by simply reading it through, so we create visualisations to capture and summarise different aspects of that information. We want to better understand where objects moved from and where they have gone; the issue was how best to visually represent that information.
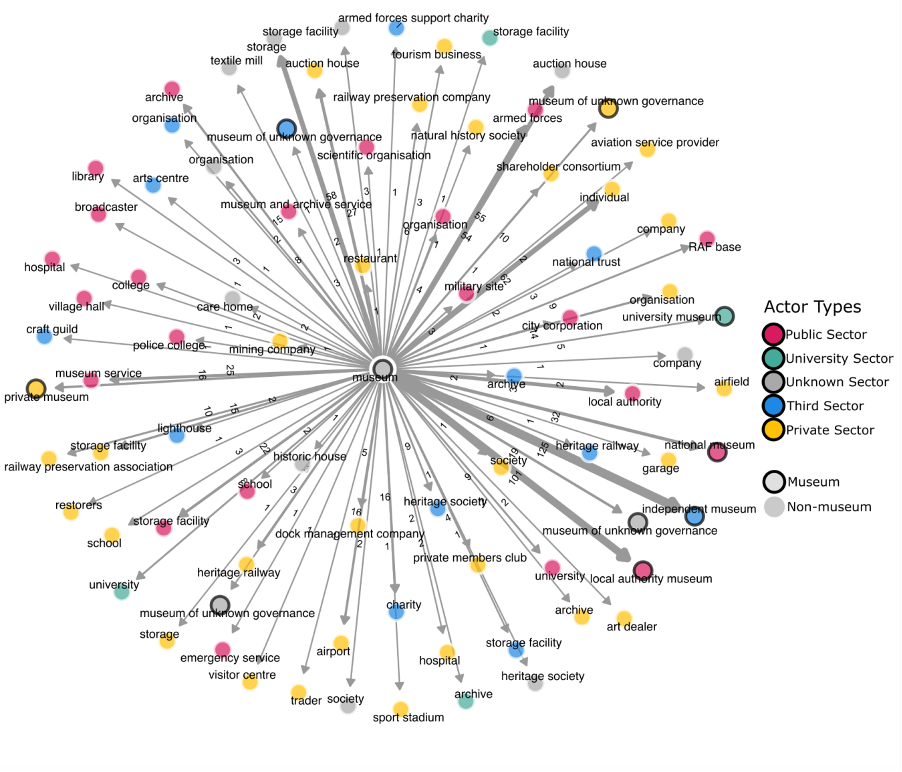
Figure 1. Dendrogram representing collection dispersal from UK museums 2000-24: pathways starting from all closed museums.
The first figure we used is known as a dendrogram (dendron means ‘tree’). The circle in the middle stands for all closed museums and the others stand for the recipients. This gave us a quick and striking indication of the sheer variety of destinations – objects moved from museums to heritage organisations, railway preservation societies, schools, mining companies, private individuals, and even airports. It was colour coded to help us differentiate between different kinds of entities: those in the public or private spheres, the third sector, and universities (which are not a neat fit with the others). We also labelled the lines or ‘edges’ with the number of transactions made, so we can see that there were sixteen transactions from closed museums to dock management companies and twenty-seven to auction houses and the lines are thicker where there were more transactions. (Please note that the data collection is not yet finished so the numbers are not yet final. Our focus here is on modelling, not the data contained within the visualisations).
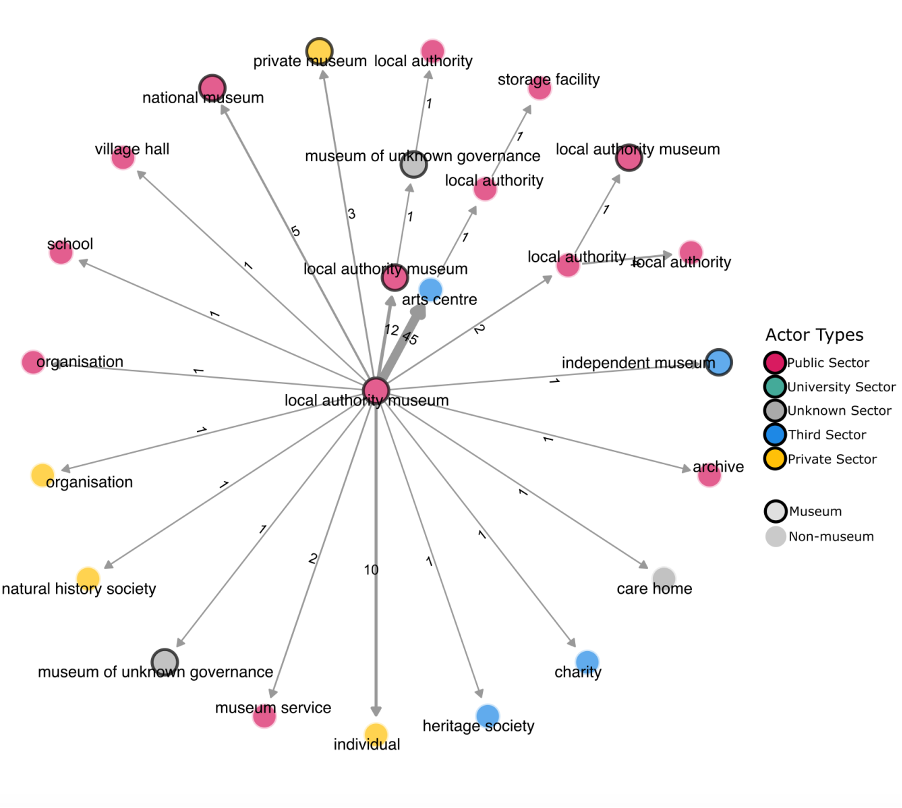
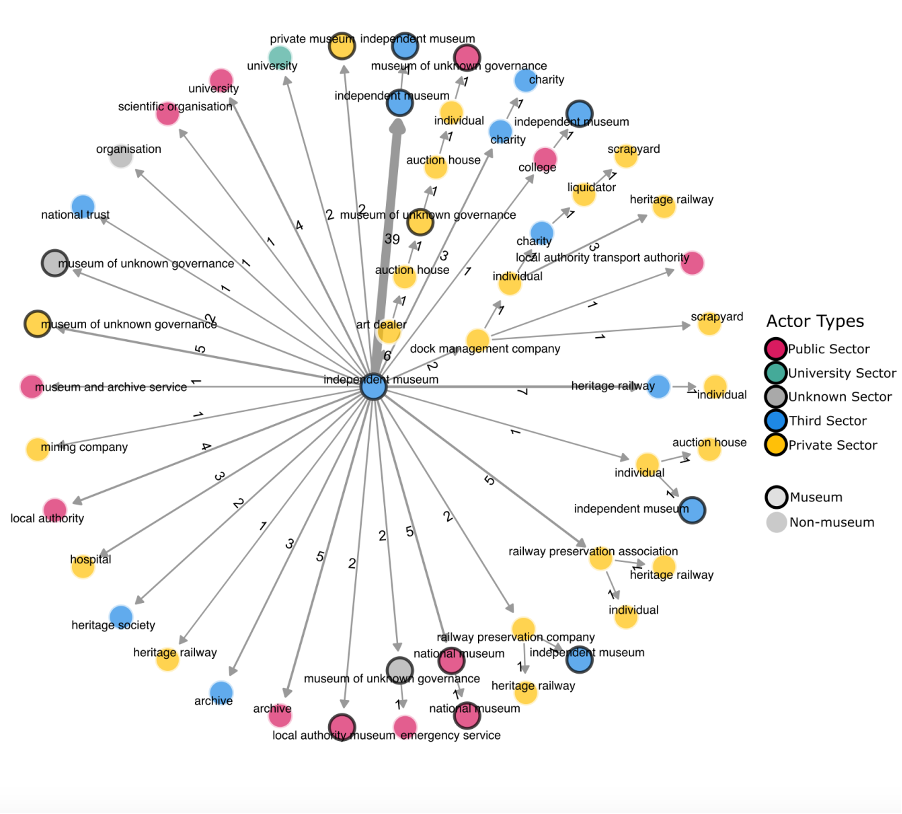
This dendrogram was very general, so we filtered the data by museum characteristics, including governance, museum size, and subject matter. Figures 2 and 3 show the distribution of objects from closed local authority and independent museums, respectively. These figures also showed instances where objects had made more than one ‘jump’, for example moving from a closed museum a local authority and thence to a library or historic house.
Figure 2. Dendrogram representing collection dispersal from UK museums 2000-24: pathways starting from closed Local Authority museumsFigure 3. Dendrogram representing collection dispersal from UK museums 2000-24: pathways starting from closed independent museums
These figures were useful because they showed the differences in the patterns of closure according to governance. We could quickly see that objects from independent museums went to a much wider range of destinations than those from local authority museums. However, we wanted to be able to make more direct comparisons: to see the museums of different types and their destinations alongside each other.
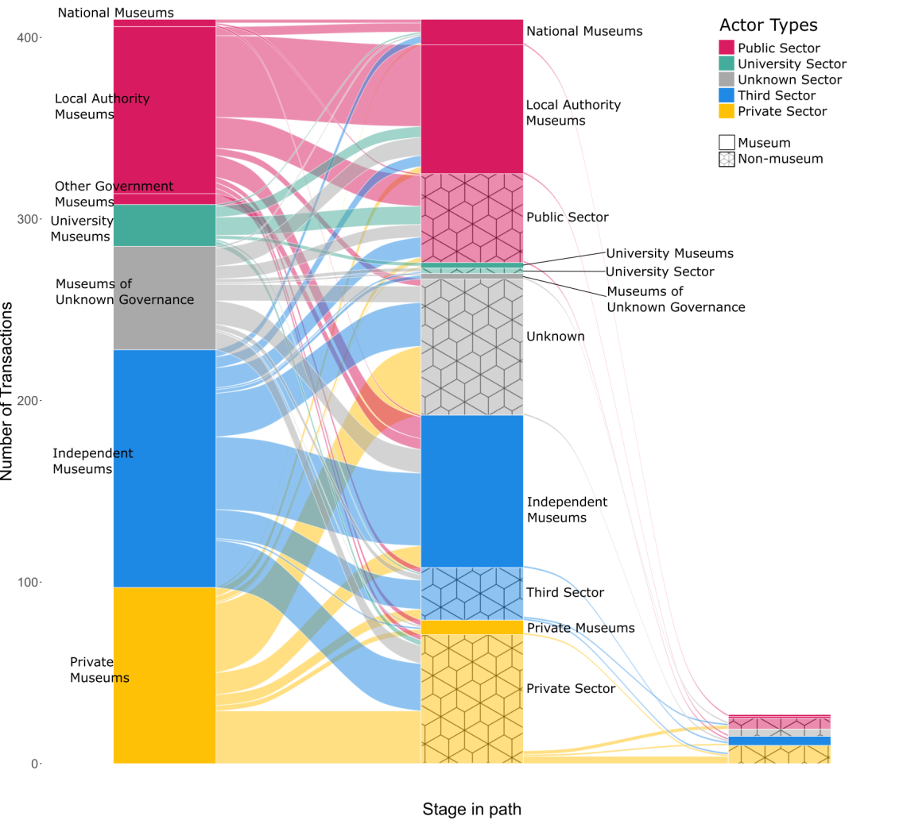
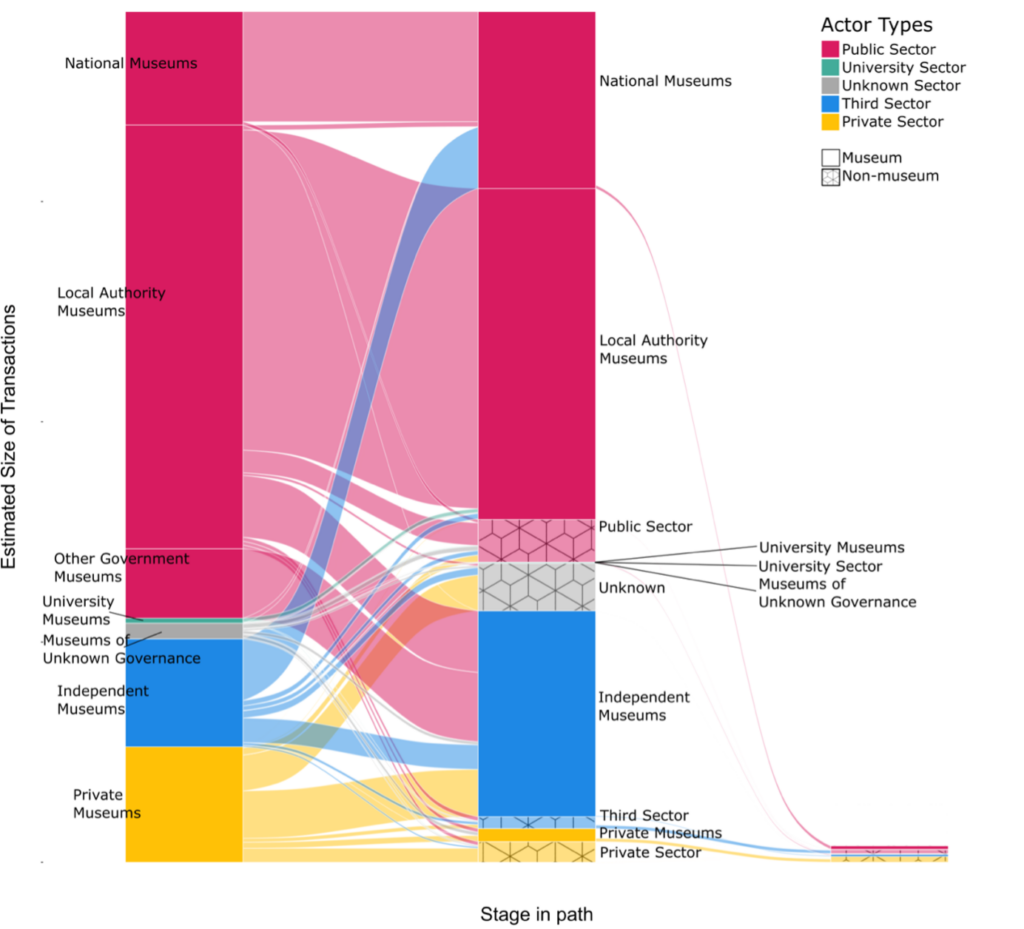
Our next step was to create alluvial diagrams, which are used to show flow and change over time. In Figure 4 the bar on the left represents the different types of closed museums, the columns on the right represent recipients, and the ribbons between them indicate the flow of objects from one to the other. The lines are coloured by source, and the actors are grouped by governance and economic sector.
Figure 4. Alluvial diagram representing collection dispersal from UK museums 2000-24: Size of block calculated by number of transactions
So far, so good. The problem now lay in how to better represent the quantities of objects flowing out of the closed museums, and that was a much more difficult issue because it concerned the precision and detail of the available data. In some cases, we knew that a museum’s entire collection was transferred to another institution. In the spreadsheet this is logged as a single transaction: when museum X closed, all the collection went to Y. In other cases – often transport museums – we had extremely detailed information about the individual items in a collection and where they went. We wanted to capture all the information we possibly could, so each itemised transaction is included in the spreadsheet. For instance, Clarke Hall Educational Museum made transfers to sixteen recipient organisations whereas the collection from Manor House Museum was moved wholesale to the Moyse Hall Museum in Suffolk. In Figure 4 the size of the coloured blocks in the bars and the width of the ribbons relate to the number of transactions, so the sixteen transactions from Clarke Hall occupy more visual space than the single transfer from the Manor House Museum, irrespective of the size of the collections. This was an unsatisfactory solution.
To complicate matters further, some of the information we received was far less specific. It was common for stakeholders to say things like ‘some of’ the collection went to a local museum, ‘a few things’ to the town hall and ‘everything else’ went to the school. These are clearly relative measures and depend on how big the collection was in the first place. ‘Most of’ one collection may be roughly equivalent to ‘a bit’ of another. And it is rare to be able to establish the size of a collection, even when the museum is open. How then were we to model the data we had received?
The project team devised a work-around. We estimated the relative size of transactions using the formula: (museum size x collection size), with museum size being the midpoint of the categories used in the original Mapping Museums research (small = 5,000; medium = 30,000, and large = 500,000 visitors per year) and collection size being quantified as (few = 5%; some = 25%; half = 50%; most = 80%; all = 100%). National and local authority museums tend to be larger and as you can see in Figure 5, transactions of collections starting in national or local authority museums tend to have thicker ribbons than those starting in independent museums.
Figure 5. Alluvial diagram representing collection dispersal from UK museums 2000-24: size of block determined by relative size of transaction
Figure 5 was an improvement, but there were still problems. Firstly, the figure gave no indication of how many museums were involved in these transactions and second, there was no way to visually convey the uncertainty of the data. Third, the alluvial diagram created visual continuity between very different entities: national museums, private museums, and airports all occupied the same neatly bounded space, implying connections or similarities which did not necessarily exist.
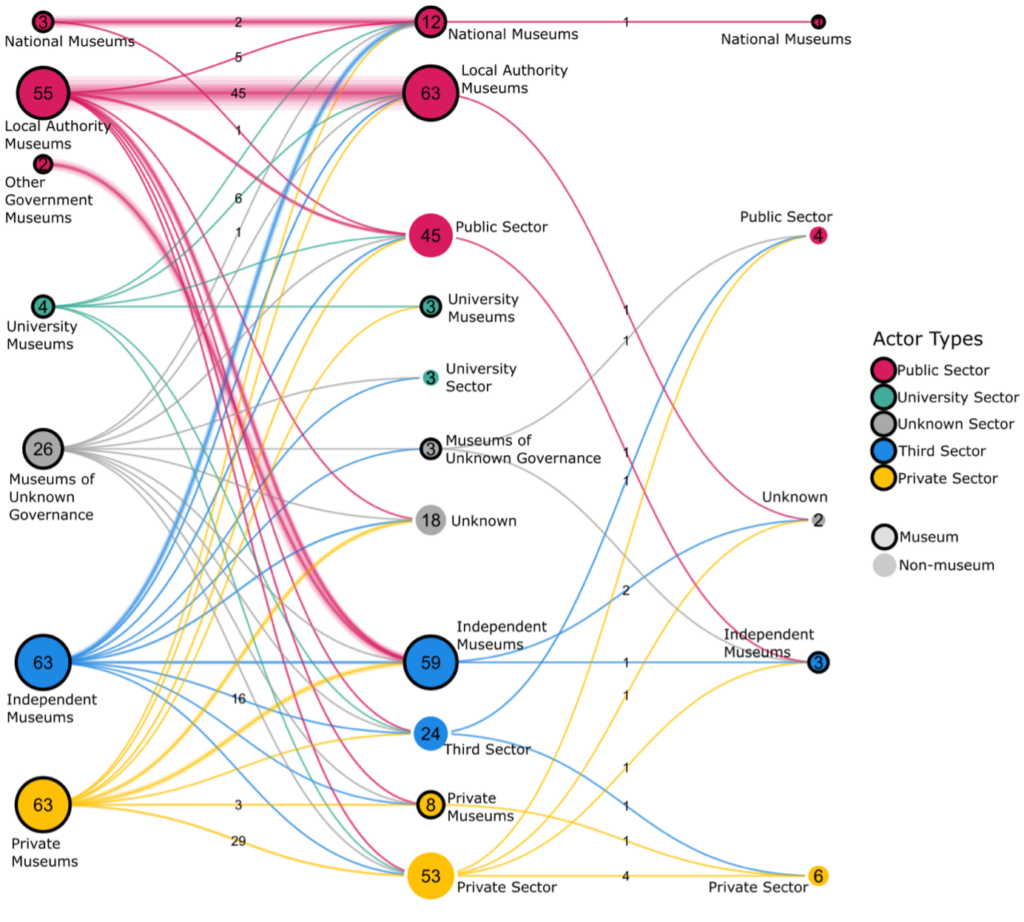
Figure 6. Network diagram representing collection dispersal from UK museums 2000-24 (pathways move from left to right)
It was time to try a different tack, so we started experimenting with network diagrams. The lines represent flows of objects between actors and move from left to right. Closed museums are represented by circles on the left, recipient organisations in the middle, and any further destinations on the right. Using a network diagram helped solve the problem of visual continuity. It also enabled us to plot the number of museums involved and the size of the transactions and to register a degree of uncertainty: the size of the circles indicates the number of museums or recipients, while the line between is both labelled with actual numbers and uses an additional band to show the estimated sizes of those transactions. Using the network diagram, it became possible to make statements such as:
‘We know of 55 local authority museums which closed during this time. We know that there were 45 transfers of ownership from closed local authority museums to other local authority museums. We think that these transfers involved a relatively large quantity of objects’.
So far this seems to provide the best solution to modelling our data, but it is still work in progress and we welcome any comments.
We’ve been working on our project about museum closure for just over a year. We set out to collect information about the collections of around 500 closed museums, and our stated ambition was to cover at least 70% of them. Some of our team had prior experience of researching closed museums and knew that details were often hard to come by, so that target seemed realistic. A year on, we’ve done much better than expected. Of our initial list we have found information on over 90%.
What remains is a list of what we’re calling the stuck museums. In these cases we think we’ve exhausted our avenues of enquiry, and still don’t have information on what happened to the collections.
What have we tried? An incomplete list: Googling; meeting members of the Museums Development Network; contacting local history societies, who often had leads but sometimes knew no more than we did; asking nearby museums; consulting local authority planning documents that indicate the change of use of premises; examining auction catalogues; searching newspaper archives; for one case visiting the National Archives and for another two, the archives of British Telecom; searching social media; picking the brains of the Arts Council’s Accreditation team; using the Wayback Machine; when no contact details existed bar a postal address for directors of the small company that ran the museum, writing letters – an unusual activity in 2024; making Freedom of Information requests to local authorities when informal enquiries went unanswered; joining specialist groups on Facebook for collectors of paperweights, Matchbox cars, and antique dolls, to name just three.
That’s not all. We’ve also tried: asking members of the Subject Specialist networks; emailing the foremost writer in English on the work of a Japanese novelist; contacting organisations that used to run the museums or who now occupy the site; having obtained snippets of information, more precisely targeted Googling; interviewing specialists in regimental and transport museums; emailing local politicians, drinks manufacturers, race courses; attempting to contact a retired magician; using a website that lists the destinations of former military aircraft; seeking help from the unofficial historian of a major football club; interviewing the biographer of a man who ran two shipwreck museums; asking local libraries; reading council reports and collection development policies; asking the police (about police museums); meeting an expert on recent local authority museum closures; emailing hospitals; writing to the BBC; asking former curators, a local board of education, the National Trust, auction houses; interviewing outgoing curators.
This may sound exhaustive (and exhausting). We’ve been as thorough as we can, yet for some museums we remain stuck, with little or no information on what happened to the museums or their collections.
Can you help us with any of them? We’re looking for information on why the museums closed, what happened to their collections, and what their buildings are now used for, if they still exist.
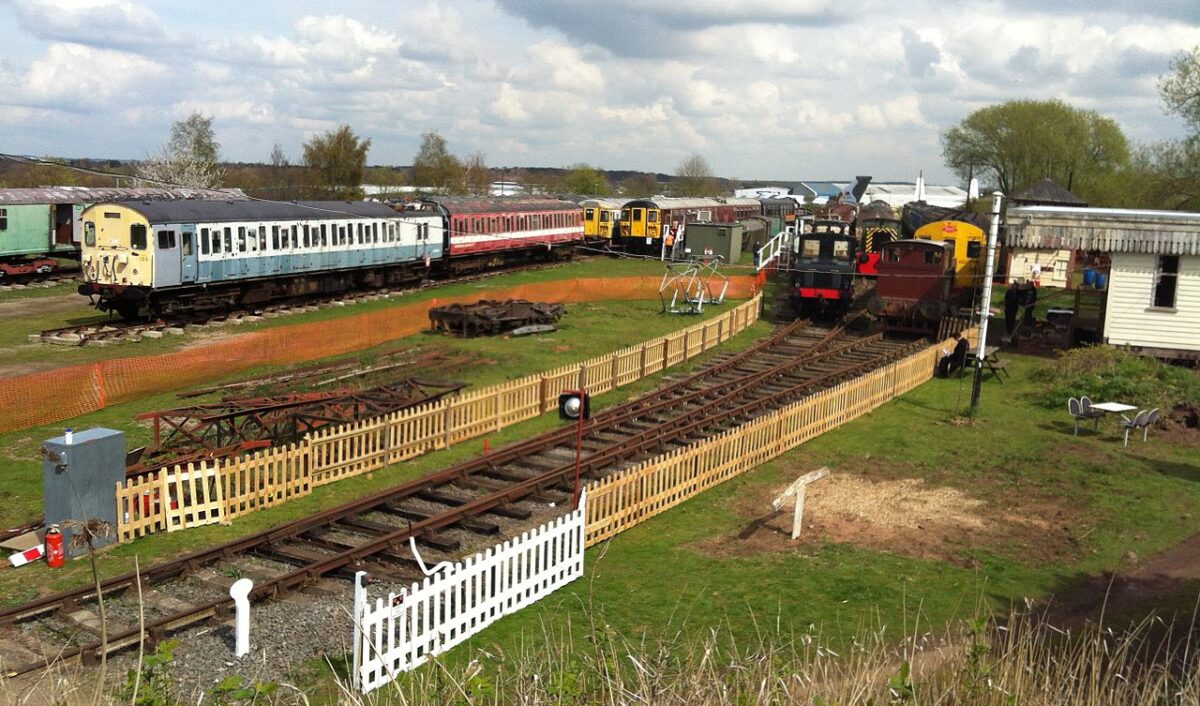
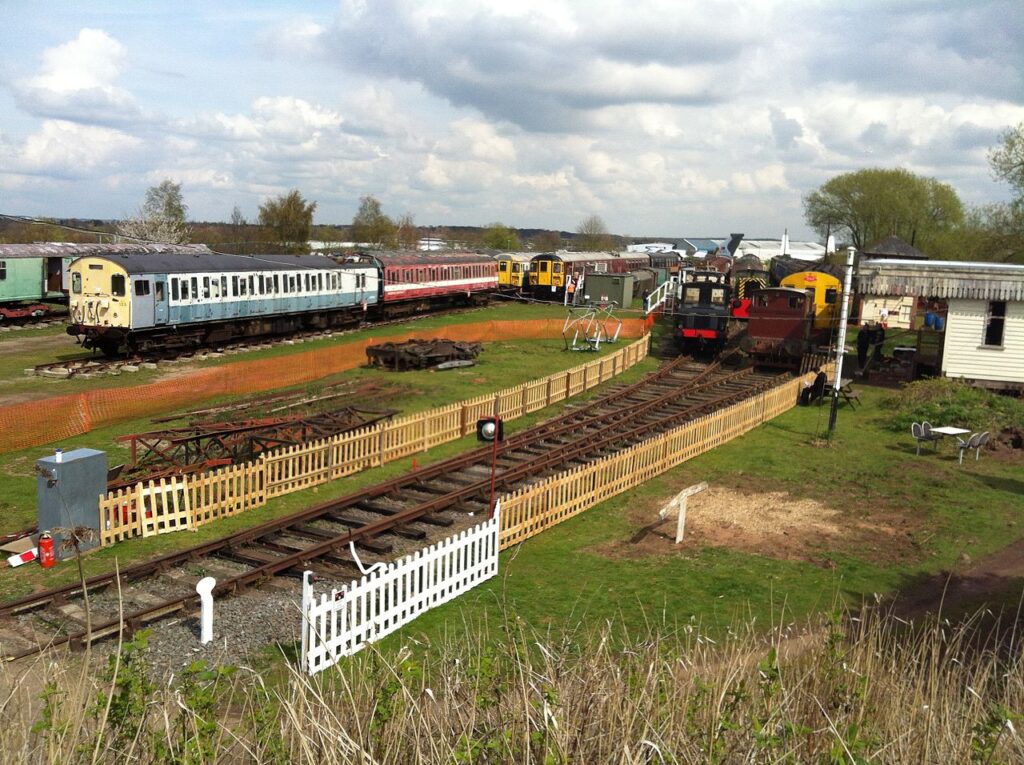
The Electric Railway Museum in 2012. Photo: Fairfaithfull on Wikimedia Commons
The Mapping Museums Lab have been collecting data on over 450 closed museums, including what happens to their collections and buildings. As we gather information about collections, we’re learning that the data available varies widely from one museum to another. In some cases we’ve obtained a list of where every exhibit went, with the type of destination (such as a museum or private storage facility), and sometimes the state of repair of individual objects. In other cases, we have gathered little more than that the collection was sold, often at auction, and dispersed into private hands.
We’re in the relatively early stages of a two-year project, but some patterns are already starting to emerge. For instance, legal processes can have the effect of producing better public documentation for collection dispersals. Liquidators managing company insolvencies produce annual reports, which detail the disposal of assets, and a set of those reports were produced when the parent charity of the Yorkshire Waterways Museum went into liquidation. A more controversial example is the British Empire and Commonwealth Museum, where accusations of impropriety led to numerous news reports that documented the complex trajectories of some of the exhibits. Although Bristol Museums now look after the bulk of the collection, the whereabouts of some items formerly held by the BECM are still unknown.
The type of object displayed can make a big difference to the amount of information available. Museums of aviation and railways, which in the cases we’re looking at often display a fairly small number of large objects, are particularly well documented. One example is the Electric Railway Museum, which was a collection of locomotives, electric multiple units and related items, sited near Coventry. The museum’s founder kindly supplied us with a detailed list of the whereabouts of the collection, and the ownership status of each object.
The Electric Railway Museum in 2012. Photo: Fairfaithfull on Wikimedia Commons
The collections of closed aviation museums can also be fairly straightforward to track. Each plane, in addition to having a manufacturer and model, also has a unique identification number that enables its whereabouts to be found. I have never needed to visit the Demobbed website before starting this project, but that database of former military aircraft has proved invaluable in tracking down some of the planes that were held by now-closed museums. Demobbed features extensive lists of aircraft locations maintained by the Wolverhampton Aviation Group, who are evidently a dedicated community of enthusiasts. Each plane’s history is detailed, including whether parts of it, such as nose cones, were removed and dispersed.
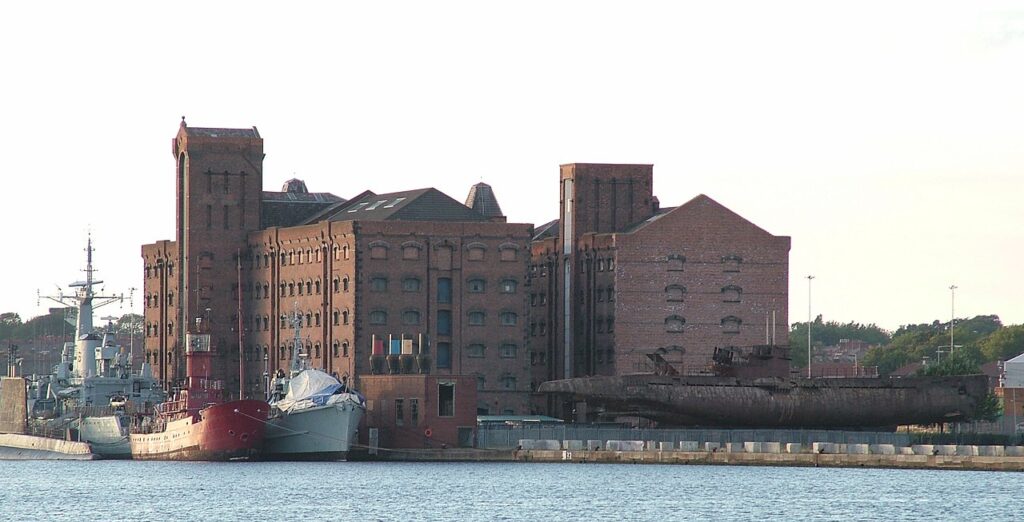
Museums featuring ships and boats have also been relatively easy to track. The small collection of five ships and submarines once held by the Warship Preservation Trust in Birkenhead has been exhaustively documented. This is partly due to a museum and a heritage organisation acquiring two of the vessels. But thanks to enthusiasts keeping an eye on the others, documenting them online and sometimes campaigning for their preservation, we know that a submarine and the frigate HMS Plymouth were scrapped, while the last known destination of the minesweeper HMS Bronington was a dock in Birkenhead, where it had partially sunk at its moorings.
But for another maritime collection there is more uncertainty about destinations. The large collection of boats at the Eyemouth Maritime Centre was sold at auction in 2017. The sale attracted a fair amount of attention from boating enthusiasts, which means that we have been able to track the destinations of quite a few of the boats. However, around 100 boats were reportedly purchased by a collector and cut up to enable transportation to China. This shipment was apparently intended for a new maritime museum but we don’t know whether it ever opened, leaving the whereabouts of a substantial part of the Eyemouth collection unknown.
Warships Preservation Trust. Photo: Chowells on WikiMedia Commons.
Although planes, trains, and ships have been easy enough to track down in many cases, car and motorcycle museums are another matter. So far, we’ve found that many of these collections go to auction and are subsequently dispersed to private buyers. Occasionally it’s possible to discover that some items have gone to museums, but not always which ones. The auctioneers of the London Motorcycle Museum told us that three of the bikes had been purchased by museums, but our enquiries have not revealed precisely where they went. The case of the Cars of the Stars museum, mentioned in a previous blog, where the collection went to just one buyer who also runs a museum, appears to be quite unusual. As the destinations of auctioned items are rarely reported, that type of museum dispersal is often the end of the trail for us.
Wheldale at Yorkshire Waterways Museum in 2005. Photo by George Robinson on WikiMedia Commons.
As our research continues, it’s becoming apparent that although some collections are very well documented, sometimes down to the level of individual items, in many cases we are simply recording groups of items as moving from a closed museum. And it’s unfortunately quite likely that we will never know what has happened to many others, with the destinations of items and even whole collections left unrecorded. Those differences in what we can find out have implications for how we analyse our data. We don’t want to over-represent some collections in our analyses simply because we have more details about them, or under-represent others that are less well documented. As a team we’re continuing to discuss how best to grapple with that problem.
Are museums more likely to close in areas of higher deprivation? It seems an obvious question. The more deprived an area is, the less capacity the council has for raising revenue from business rates and council tax, and the more likely it is to have to cut non-statutory services, such as museums. Meanwhile independent museums in deprived areas might struggle due to the lack of disposable income. Except that turns out not to be the case.
In the last blog we considered closure according to region, which provided us with an overview of museum geography in the UK. In this blog we take a more granular approach and draw on the Index of Multiple Deprivation. This is the official measure of relative deprivation in the UK and is assessed on a combination of household income, employment, education, health, crime, barriers to housing and services, and living environment. Using the index allows us to look at deprivation in relation to small areas with around 1,500 residents apiece, which then enables a more nuanced understanding of where museums are located and the types of places where closure occurs. Deprivation is calculated differently in Northern Ireland, Scotland, and Wales, making comparisons difficult, so in this blog we focus only on England.
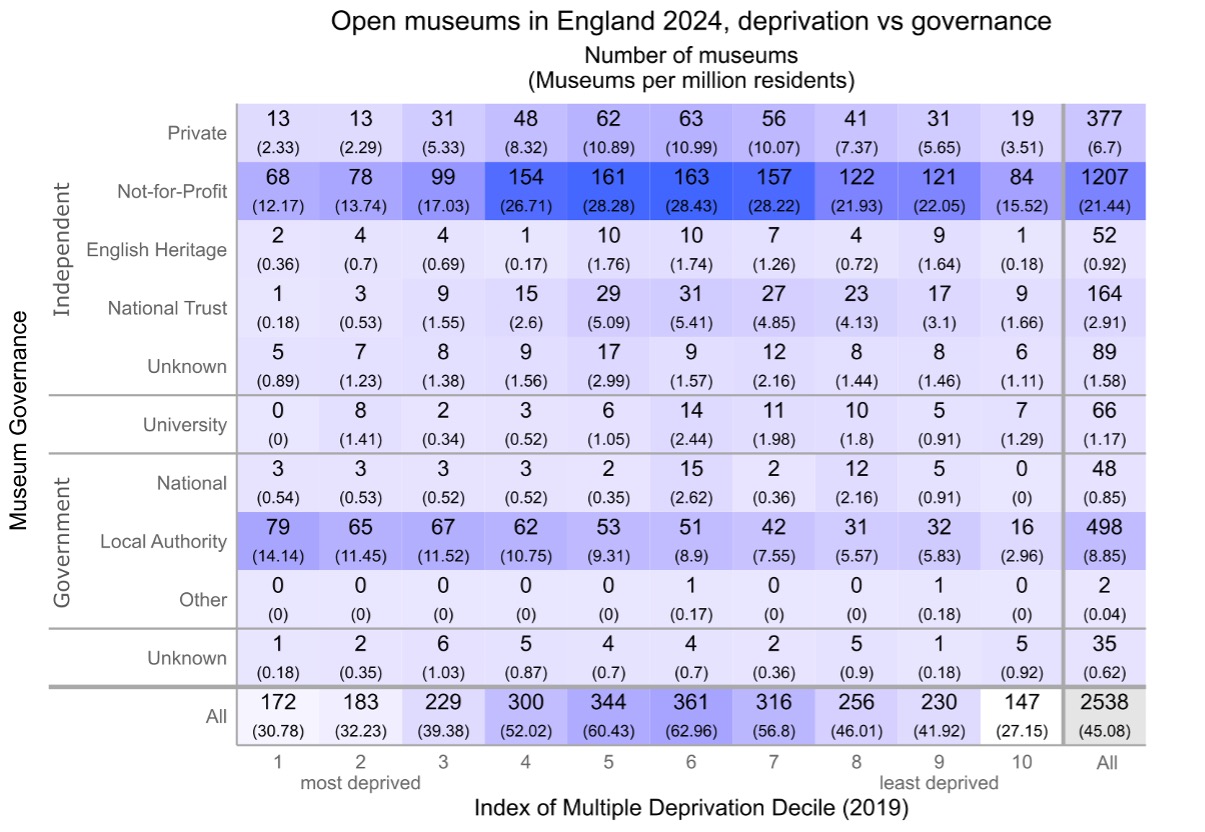
Table 1. Museums in 2024: deprivation vs governance. Darker blue indicates a larger number of museums (click to enlarge)
Table 1 shows the distribution of open museums across England as of the beginning of 2024. They have been classified according to governance and the deprivation of the ward in which they are located. As you can see, all kinds of museums can be found in almost all areas – irrespective of deprivation. There are no national museums in the least deprived areas and no university museums in the most deprived, although both these types of museums have relatively small numbers. Most notably, private, and independent (not for profit) museums cluster in the middle ground, while local authority museums tend towards the most deprived.
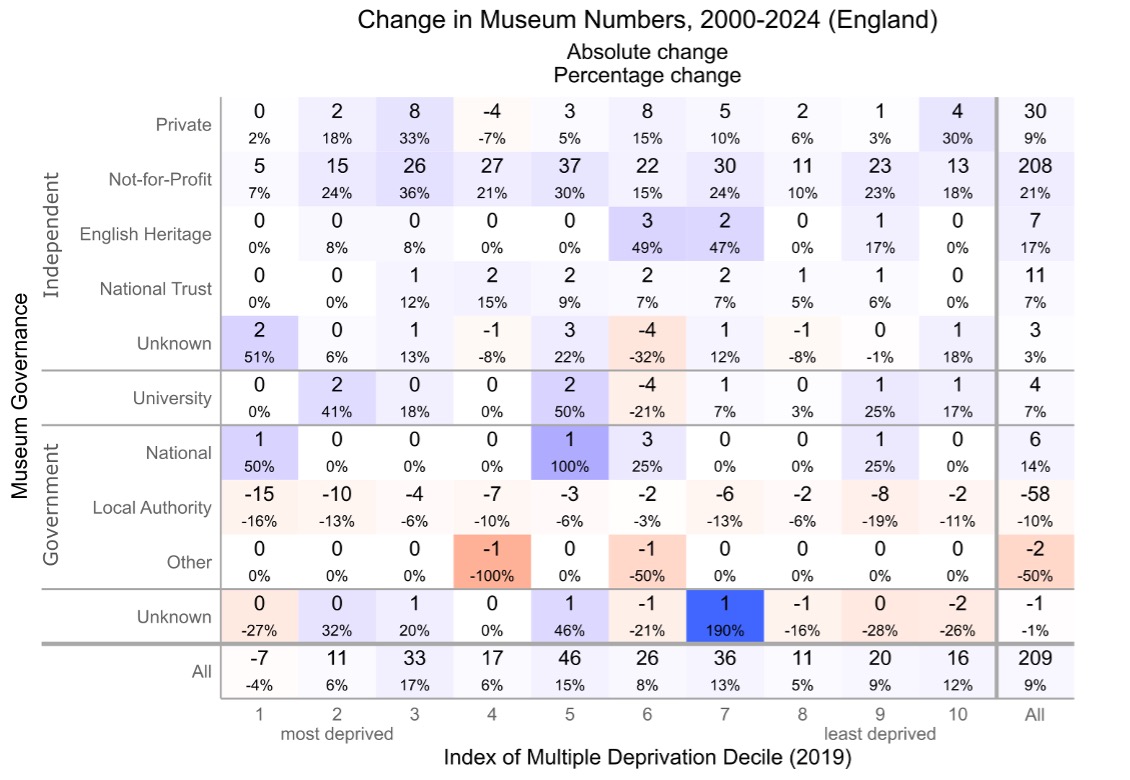
Table 2. Changes in museum numbers 2000–24: deprivation vs governance. Blue indicates growth in museum numbers, red indicates decline in museum numbers. Deeper colours indicate a larger percentage change. (click to enlarge)
Table 2 shows change in the number of museums since 2000 and gives the percentage change in each category. As we outlined in our previous blog the number of independent (not for profit) and private museums rose since 2000. Here we can see that the expansion in numbers of not-for-profit and private museum goes across the spectrum of deprivation with large growth in the middle.
The number of Local Authority museums has decreased since 2000 but there has been less decrease in the middle ground. There has been a greater decrease in the number of Local Authority museums at the edges of the spectrum, that is in areas of most and least deprivation.
There are two important caveats to this data. Firstly, the Index of Multiple Deprivation does not equate to average affluence or poverty. Rather it looks at most and least deprived, which is slightly different. So for instance, one area may contain pockets of extreme wealth and considerable deprivation, whereas another may be less affluent but also have little deprivation in the sense that residents are all in employment, there are low rates of crime, and so on. According to the Index the first area is more deprived – there is some deprivation amid the wealth – while the second is less deprived.
The second caveat is that a museum’s location is not synonymous to the visitor catchment area. These small areas represent the immediate geographic context in which a museum is sited and visitors may come from much further afield. The degree to which they do so depends in part on the type of museum in question; whether it is a national, regional, or small local museum. Going forward we will be thinking further about calculating the distribution of museums and change according to the visitor catchment area.
Yet despite the caveats, the data shows that change in the sector does not neatly align with levels of deprivation. We cannot link museum closure to deprivation or indeed growth in numbers to a lack of deprivation.
At least 467 museums have closed in the UK since the beginning of the millennium.1 For organisations that aim at keeping their collections for posterity that figure may seem high, but it is important to realise that for most of the past twenty-four years, more museums have opened than closed. The sector is still bigger now than it was in 2000. The more pertinent question is which types of museums have closed and where? Are parts of the sector thriving while others struggle? When did they close: are we on an upwards or downwards trajectory or is the sector flatlining? Over the next few months, we’ll address all these questions. In this blog we’ll concentrate on governance, looking at the differences between governance types, and if those are nuanced with respect to region.
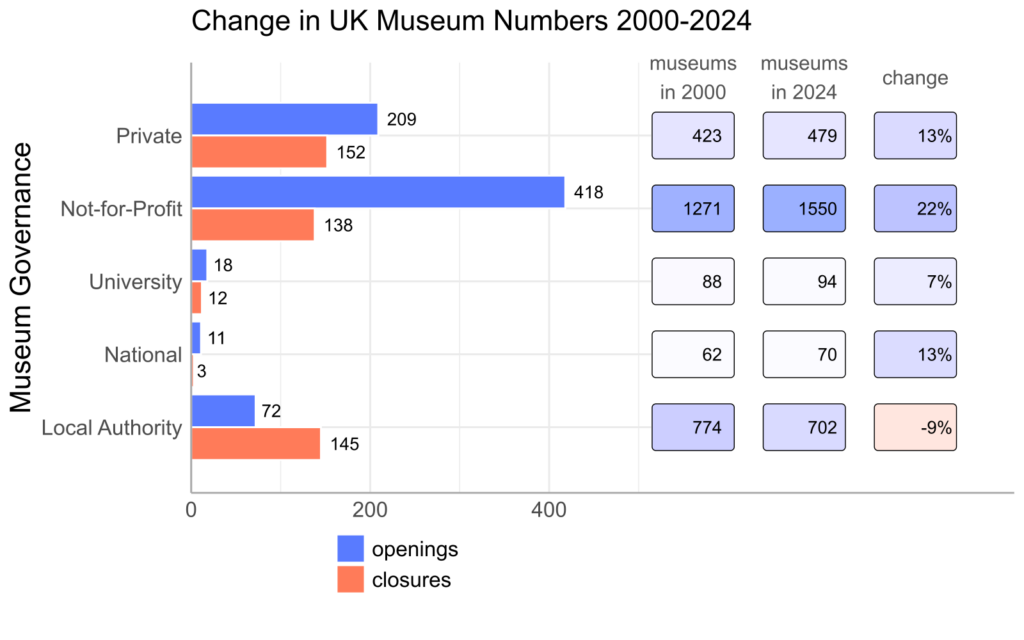
Table 1: Increase and decrease in museum numbers by governance (click to enlarge)
Table 1 shows that around 138 independent (not for profit) and 152 private museums definitely closed during the period under study. Those numbers are far outweighed by openings. Since 2000 some 418 independent (not for profit) and 209 private museums have opened, which more than offsets the numbers of closures. There are far fewer university and national museums, but like not-for-profit and private museums, their overall numbers have also risen. Twelve university museums have closed and eighteen opened, and three national museums or additional branches have closed with eleven openings. In terms of overall numbers at least, the private and independent (not for profit) museum sectors have collectively managed to ride out waves of austerity, the pandemic, and the cost-of-living crisis. The same is not true of local authority museums, 145 of which have closed with only 72 opening, a loss of 73 museums.
It is easier to grasp what is happening in the museum sector if we frame openings and closures in terms of percentage change. That approach takes the numbers of closures and openings for each group of museums into account and judges them against the total number of museums in that category. Looking at Table 1 we can see that the overall number of independent (not for profit) museums has risen by a substantial 22%, private and national museums by around 13%, and university museums by 7%. In stark contrast, the change for local authority museums is -9%.
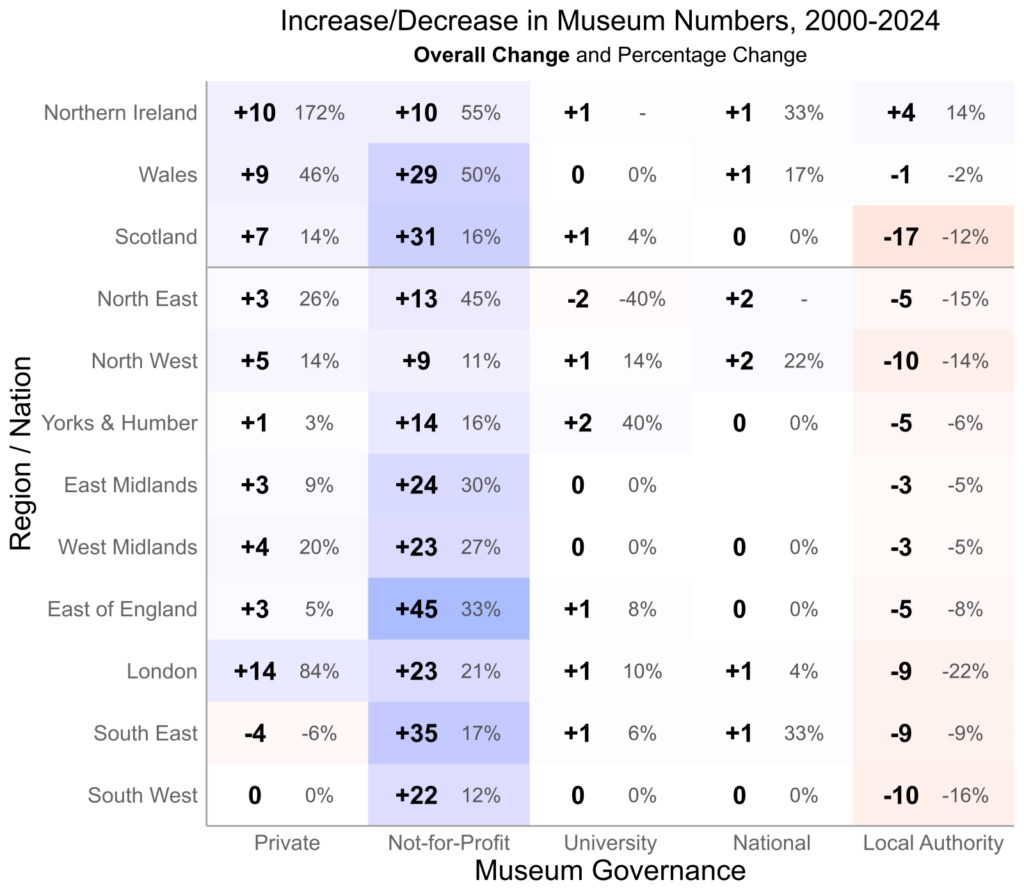
Table 2: Increase and decrease in museum numbers: governance vs region (click to enlarge)
So where exactly are these museums opening and closing? Table 2 shows us that growth among independent (not-for-profit) museums, has been spread across all the nations and English regions regions most notably Wales, Scotland, and the East of England. Conversely, the number of Local Authority museums has decreased in all regions, the exception being Northern Ireland (where the museum sector has consistently had different patterns of growth and closure to the rest of the UK). The dropping numbers of Local Authority museums is the most worrying aspect of museum closure over the last twenty-four years. Scotland lost by far the most local authority museums, with a drop of seventeen since 2000, that is, 12% of its total. However the situation is perhaps more troubling in London which lost nine local authority museums, a decrease of 22%, the largest in the UK. Although the capital is well served by national museums, they are mainly located in the centre of the city and serve a national and international audience, whereas the Local Authority museums are mainly in the outer boroughs and are usually conceived as a service for the neighbourhood.
We also want to point to the areas that have low growth among independent museums and have simultaneously lost a higher proportion of Local Authority museums – particularly the North West. In these areas, the overall levels of museum provision, and hence the benefits that they may provide in terms of access to public space, informal education, culture, and just pleasure, are being correspondingly reduced.
In our next blog we will be looking at social deprivation and exploring the issue of closure and access to museums in more detail. Please subscribe to receive further posts on our work in progress and new findings.
Fiona Candlin and George Wright
A note on numbers: In most cases, we have a definite year for museum closure. In some cases, we have a date range. For example, we may know that a museum closed at some point between 1995 and 2005 but cannot determine exactly when. In these instances, we calculate the probability of it having closed after 2000 and factor that information into the analysis. That can lead to some slight discrepancies in the totals, for instance when one number is rounded down and another rounded up. Apart from the headline number of 467 definite closures since 2000, all the data reported in this post are based on probabilistic estimates. Our best estimate of the total number of closures is 534. ↩︎
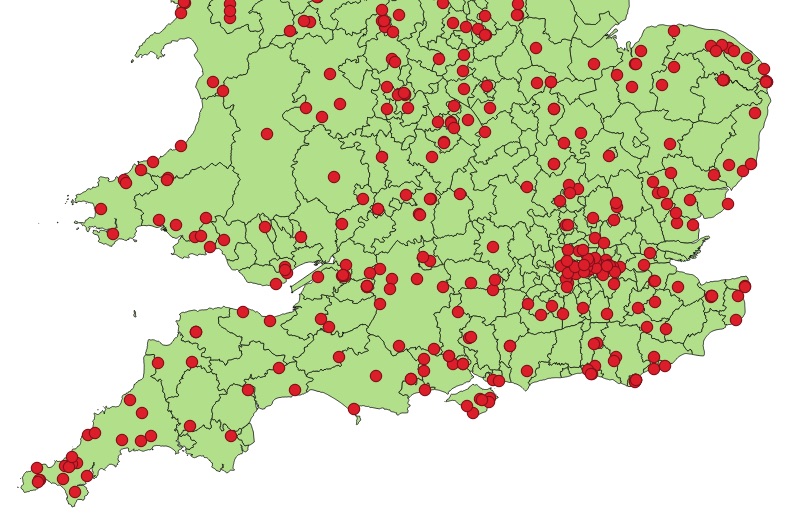
Urban areas, in particular large cities, have fewer museums relative to their population than rural areas. Seven of the ten local authorities with the fewest museums per 100,000 people in the UK are London boroughs. Those local authorities with the higher proportion of museums tend to have small not-for-profit local history museums.
We are pleased to announce that the Arts and Humanities Research Council has awarded £1million to the Mapping Museums research team for their project ‘Museum Closure in the UK 2000-2025’.
The new research will use trans-disciplinary methods to analyse closure and collections dispersal within the UK museums sector. Its aim is to examine the geographic distribution of closure, to better understand types of closure (e.g., whether museums are mothballed or disbanded), and to document the flows of objects and knowledge from museums in the aftermath of closure. We will investigate the afterlife of collections, find out if museum exhibits are scrapped, sold, stored, or re-used, and examine ‘outreach’ and temporary museums. A Knowledge Base will be designed to model and store the collected data, and visualisations and analyses of the data will be developed. Above all, we aim at critically reassessing notions of permanence and loss within the museums sector.
‘Museum Closure’ is based at Birkbeck, University of London and at King’s College London, and will run for two years, beginning in October 2023. It is led by Fiona Candlin, Professor of Museology, who will be working with co-investigators, Dr Andrea Ballatore (King’s College London), a specialist in cultural data science, Alexandra Poulovassilis, Emeritus Professor in Computer Science, and Peter Wood, Professor in Computer Science. The post-doctoral researcher is Dr Mark Liebenrood (museum history) and we will be recruiting a second post-doctoral researcher in data science.