Are museums more likely to close in areas of higher deprivation? It seems an obvious question. The more deprived an area is, the less capacity the council has for raising revenue from business rates and council tax, and the more likely it is to have to cut non-statutory services, such as museums. Meanwhile independent museums in deprived areas might struggle due to the lack of disposable income. Except that turns out not to be the case.
In the last blog we considered closure according to region, which provided us with an overview of museum geography in the UK. In this blog we take a more granular approach and draw on the Index of Multiple Deprivation. This is the official measure of relative deprivation in the UK and is assessed on a combination of household income, employment, education, health, crime, barriers to housing and services, and living environment. Using the index allows us to look at deprivation in relation to small areas with around 1,500 residents apiece, which then enables a more nuanced understanding of where museums are located and the types of places where closure occurs. Deprivation is calculated differently in Northern Ireland, Scotland, and Wales, making comparisons difficult, so in this blog we focus only on England.
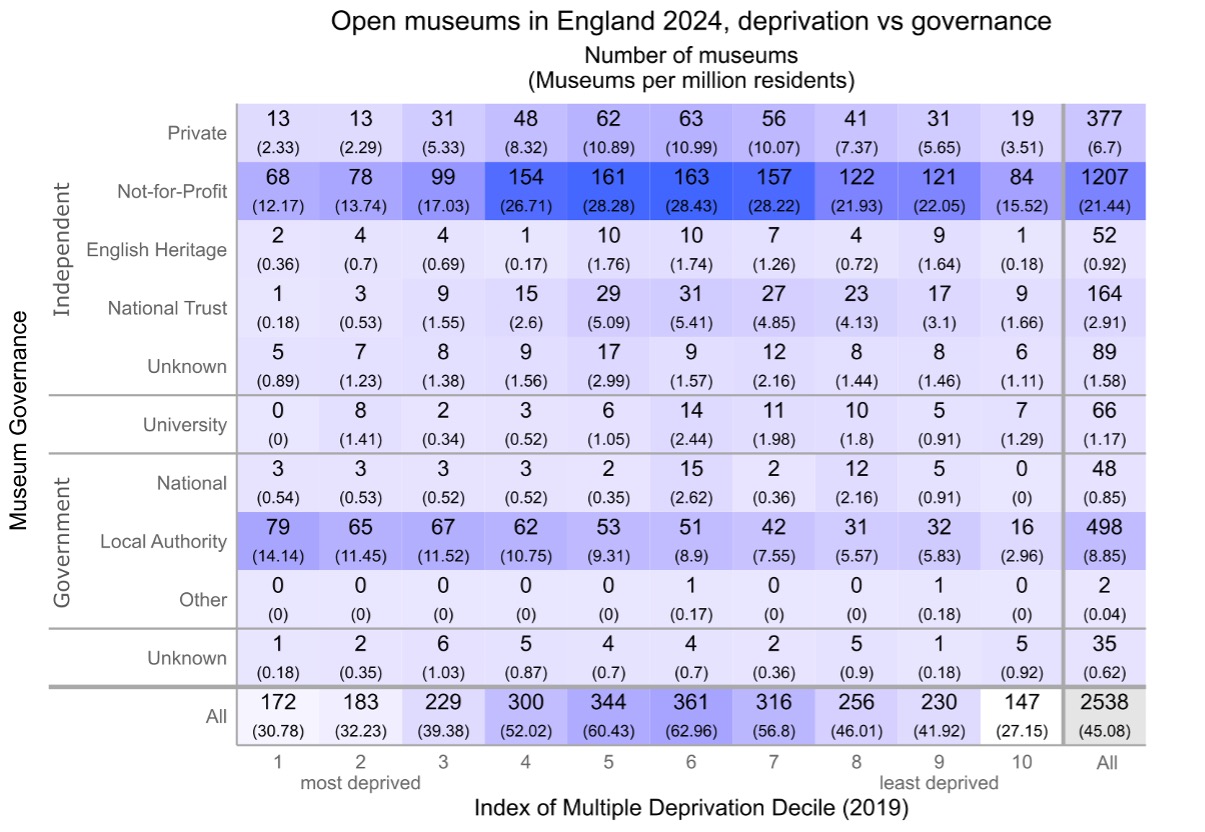
Table 1 shows the distribution of open museums across England as of the beginning of 2024. They have been classified according to governance and the deprivation of the ward in which they are located. As you can see, all kinds of museums can be found in almost all areas – irrespective of deprivation. There are no national museums in the least deprived areas and no university museums in the most deprived, although both these types of museums have relatively small numbers. Most notably, private, and independent (not for profit) museums cluster in the middle ground, while local authority museums tend towards the most deprived.
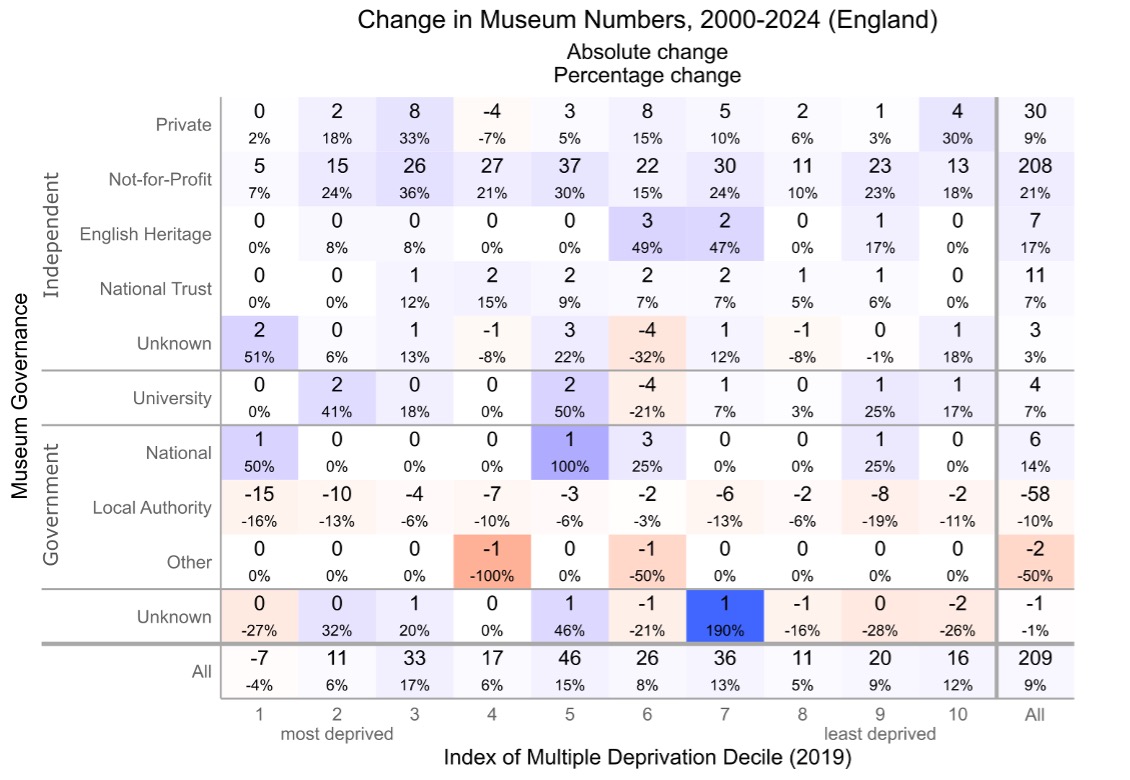
Table 2 shows change in the number of museums since 2000 and gives the percentage change in each category. As we outlined in our previous blog the number of independent (not for profit) and private museums rose since 2000. Here we can see that the expansion in numbers of not-for-profit and private museum goes across the spectrum of deprivation with large growth in the middle.
The number of Local Authority museums has decreased since 2000 but there has been less decrease in the middle ground. There has been a greater decrease in the number of Local Authority museums at the edges of the spectrum, that is in areas of most and least deprivation.
There are two important caveats to this data. Firstly, the Index of Multiple Deprivation does not equate to average affluence or poverty. Rather it looks at most and least deprived, which is slightly different. So for instance, one area may contain pockets of extreme wealth and considerable deprivation, whereas another may be less affluent but also have little deprivation in the sense that residents are all in employment, there are low rates of crime, and so on. According to the Index the first area is more deprived – there is some deprivation amid the wealth – while the second is less deprived.
The second caveat is that a museum’s location is not synonymous to the visitor catchment area. These small areas represent the immediate geographic context in which a museum is sited and visitors may come from much further afield. The degree to which they do so depends in part on the type of museum in question; whether it is a national, regional, or small local museum. Going forward we will be thinking further about calculating the distribution of museums and change according to the visitor catchment area.
Yet despite the caveats, the data shows that change in the sector does not neatly align with levels of deprivation. We cannot link museum closure to deprivation or indeed growth in numbers to a lack of deprivation.
Fiona Candlin
George Wright
Andrea Ballatore
Photo: Katy Pettit