At least 467 museums have closed in the UK since the beginning of the millennium.1 For organisations that aim at keeping their collections for posterity that figure may seem high, but it is important to realise that for most of the past twenty-four years, more museums have opened than closed. The sector is still bigger now than it was in 2000. The more pertinent question is which types of museums have closed and where? Are parts of the sector thriving while others struggle? When did they close: are we on an upwards or downwards trajectory or is the sector flatlining? Over the next few months, we’ll address all these questions. In this blog we’ll concentrate on governance, looking at the differences between governance types, and if those are nuanced with respect to region.

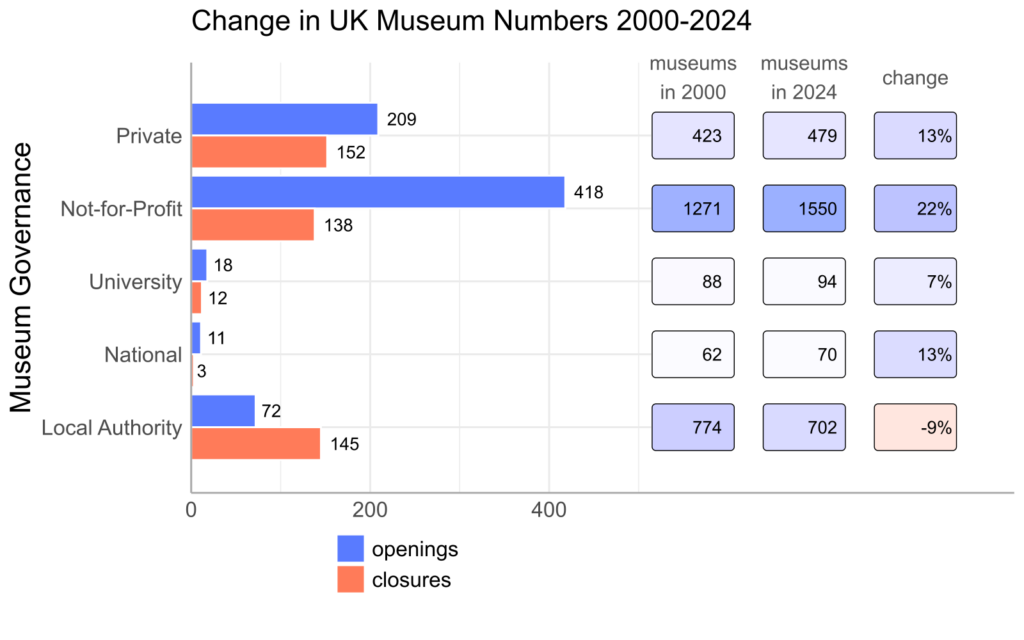
Table 1 shows that around 138 independent (not for profit) and 152 private museums definitely closed during the period under study. Those numbers are far outweighed by openings. Since 2000 some 418 independent (not for profit) and 209 private museums have opened, which more than offsets the numbers of closures. There are far fewer university and national museums, but like not-for-profit and private museums, their overall numbers have also risen. Twelve university museums have closed and eighteen opened, and three national museums or additional branches have closed with eleven openings. In terms of overall numbers at least, the private and independent (not for profit) museum sectors have collectively managed to ride out waves of austerity, the pandemic, and the cost-of-living crisis. The same is not true of local authority museums, 145 of which have closed with only 72 opening, a loss of 73 museums.
It is easier to grasp what is happening in the museum sector if we frame openings and closures in terms of percentage change. That approach takes the numbers of closures and openings for each group of museums into account and judges them against the total number of museums in that category. Looking at Table 1 we can see that the overall number of independent (not for profit) museums has risen by a substantial 22%, private and national museums by around 13%, and university museums by 7%. In stark contrast, the change for local authority museums is -9%.

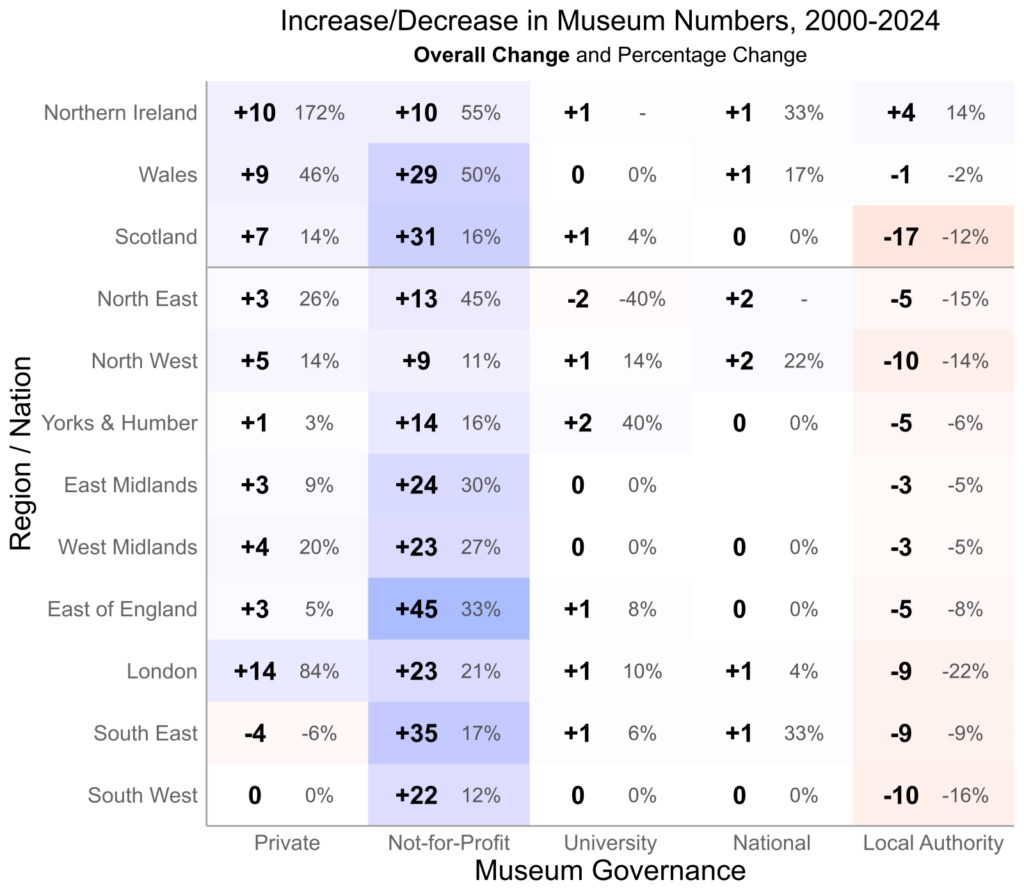
So where exactly are these museums opening and closing? Table 2 shows us that growth among independent (not-for-profit) museums, has been spread across all the nations and English regions regions most notably Wales, Scotland, and the East of England. Conversely, the number of Local Authority museums has decreased in all regions, the exception being Northern Ireland (where the museum sector has consistently had different patterns of growth and closure to the rest of the UK). The dropping numbers of Local Authority museums is the most worrying aspect of museum closure over the last twenty-four years. Scotland lost by far the most local authority museums, with a drop of seventeen since 2000, that is, 12% of its total. However the situation is perhaps more troubling in London which lost nine local authority museums, a decrease of 22%, the largest in the UK. Although the capital is well served by national museums, they are mainly located in the centre of the city and serve a national and international audience, whereas the Local Authority museums are mainly in the outer boroughs and are usually conceived as a service for the neighbourhood.
We also want to point to the areas that have low growth among independent museums and have simultaneously lost a higher proportion of Local Authority museums – particularly the North West. In these areas, the overall levels of museum provision, and hence the benefits that they may provide in terms of access to public space, informal education, culture, and just pleasure, are being correspondingly reduced.
In our next blog we will be looking at social deprivation and exploring the issue of closure and access to museums in more detail. Please subscribe to receive further posts on our work in progress and new findings.
Fiona Candlin and George Wright
- A note on numbers:
In most cases, we have a definite year for museum closure. In some cases, we have a date range. For example, we may know that a museum closed at some point between 1995 and 2005 but cannot determine exactly when. In these instances, we calculate the probability of it having closed after 2000 and factor that information into the analysis. That can lead to some slight discrepancies in the totals, for instance when one number is rounded down and another rounded up. Apart from the headline number of 467 definite closures since 2000, all the data reported in this post are based on probabilistic estimates. Our best estimate of the total number of closures is 534. ↩︎
