Categories
Museum Closure in the UK

New data on UK Museum Closure 2000–2024: Governance and region

At least 467 museums have closed in the UK since the beginning of the millennium.1 For organisations that aim at keeping their collections for posterity that figure may seem high, but it is important to realise that for most of the past twenty-four years, more museums have opened than closed. The sector is still bigger now than it was in 2000. The more pertinent question is which types of museums have closed and where? Are parts of the sector thriving while others struggle? When did they close: are we on an upwards or downwards trajectory or is the sector flatlining? Over the next few months, we’ll address all these questions. In this blog we’ll concentrate on governance, looking at the differences between governance types, and if those are nuanced with respect to region.

The chart shows the changes in museum numbers between 2000 and 2024, categorised by governance. The largest increase is for not for profit musueums at 22%, while the only decrease is for local authority museums, at -9%.
Table 1: Increase and decrease in museum numbers by governance

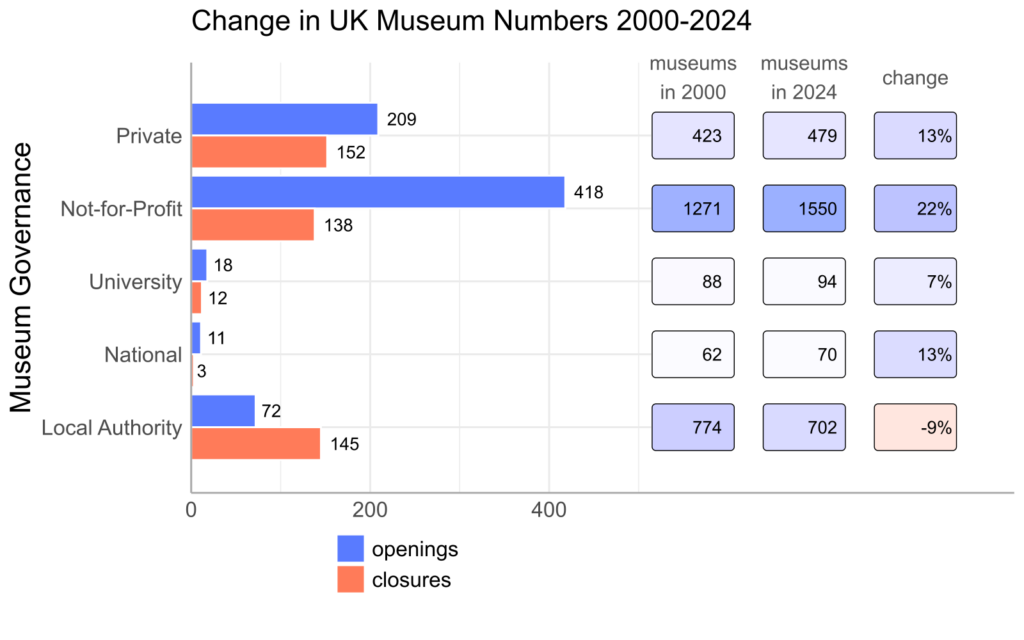
Table 1 shows that around 138 independent (not for profit) and 152 private museums definitely closed during the period under study. Those numbers are far outweighed by openings. Since 2000 some 418 independent (not for profit) and 209 private museums have opened, which more than offsets the numbers of closures. There are far fewer university and national museums, but like not-for-profit and private museums, their overall numbers have also risen. Twelve university museums have closed and eighteen opened, and three national museums or additional branches have closed with eleven openings. In terms of overall numbers at least, the private and independent (not for profit) museum sectors have collectively managed to ride out waves of austerity, the pandemic, and the cost-of-living crisis. The same is not true of local authority museums, 145 of which have closed with only 72 opening, a loss of 73 museums.

It is easier to grasp what is happening in the museum sector if we frame openings and closures in terms of percentage change. That approach takes the numbers of closures and openings for each group of museums into account and judges them against the total number of museums in that category. Looking at Table 1 we can see that the overall number of independent (not for profit) museums has risen by a substantial 22%, private and national museums by around 13%, and university museums by 7%. In stark contrast, the change for local authority museums is -9%.

The table shows increase and decrease in museum numbers between 2000 and 2024, categorised by museum governance and UK nation and English region. The largest increases are for not for profit museums, with the East of England seeing the highest rise. Local authority museums have reduced in almost all areas, with the highest closures in Scotland, North West England and the South West
Table 2: Increase and decrease in museum numbers: governance vs region

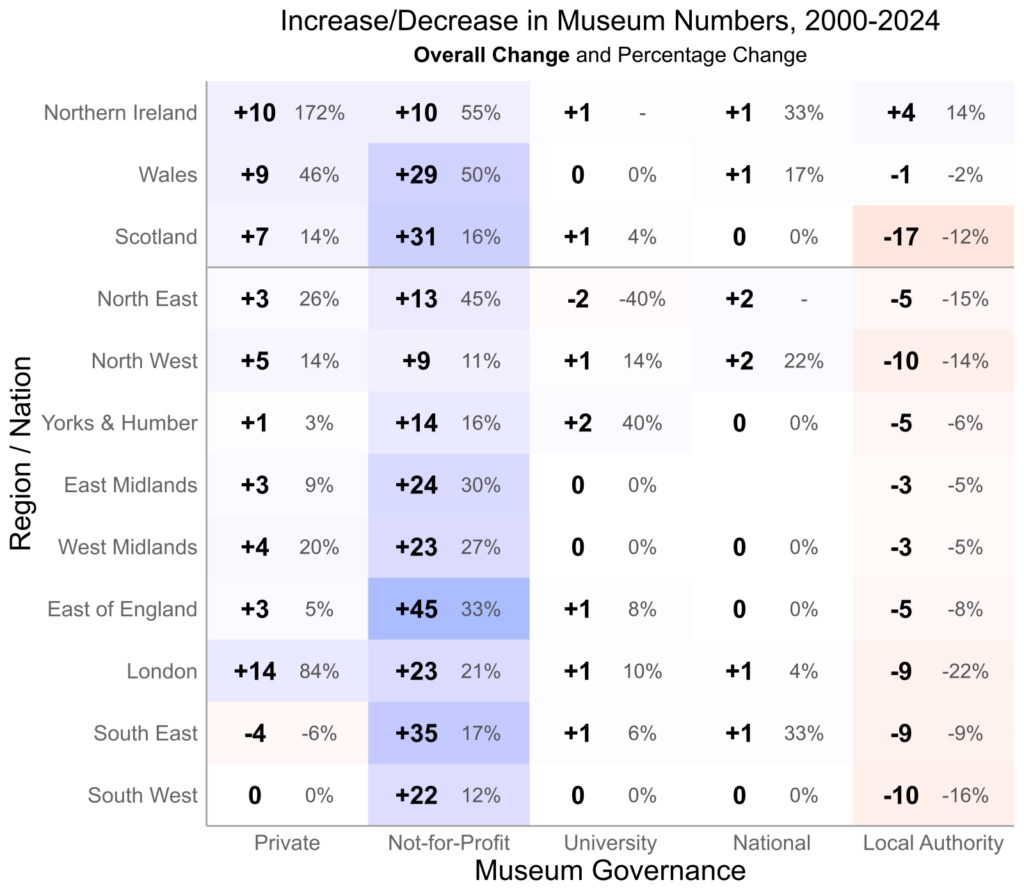
So where exactly are these museums opening and closing? Table 2 shows us that growth among independent (not-for-profit) museums, has been spread across all the nations and English regions regions most notably Wales, Scotland, and the East of England. Conversely, the number of Local Authority museums has decreased in all regions, the exception being Northern Ireland (where the museum sector has consistently had different patterns of growth and closure to the rest of the UK). The dropping numbers of Local Authority museums is the most worrying aspect of museum closure over the last twenty-four years. Scotland lost by far the most local authority museums, with a drop of seventeen since 2000, that is, 12% of its total. However the situation is perhaps more troubling in London which lost nine local authority museums, a decrease of 22%, the largest in the UK. Although the capital is well served by national museums, they are mainly located in the centre of the city and serve a national and international audience, whereas the Local Authority museums are mainly in the outer boroughs and are usually conceived as a service for the neighbourhood.

We also want to point to the areas that have low growth among independent museums and have simultaneously lost a higher proportion of Local Authority museums – particularly the North West. In these areas, the overall levels of museum provision, and hence the benefits that they may provide in terms of access to public space, informal education, culture, and just pleasure, are being correspondingly reduced.

In our next blog we will be looking at social deprivation and exploring the issue of closure and access to museums in more detail. Please subscribe to receive further posts on our work in progress and new findings.

Fiona Candlin and George Wright

  1. A note on numbers:
    In most cases, we have a definite year for museum closure. In some cases, we have a date range. For example, we may know that a museum closed at some point between 1995 and 2005 but cannot determine exactly when. In these instances, we calculate the probability of it having closed after 2000 and factor that information into the analysis. That can lead to some slight discrepancies in the totals, for instance when one number is rounded down and another rounded up. Apart from the headline number of 467 definite closures since 2000, all the data reported in this post are based on probabilistic estimates. Our best estimate of the total number of closures is 534. ↩︎
Categories
Museums in the Pandemic

Museum governance and reopening after lockdown

Which museums re-opened after lockdown restrictions were lifted in spring 2021, and did it vary by governance? In this blog we present our findings about the three largest groups of museums in our dataset: those run by local authorities, independents run on a not-for-profit basis, and private museums.

As seen in the chart below, museum websites increasingly mentioned that they were open between March and November 2021. That trend reflects the relaxation of lockdown restrictions. In April 2021, outdoor attractions began to reopen and museums in Scotland were able to reopen towards the end of the month. Museums in the rest of the UK were able to reopen in May 2021. 

A chart showing a gradual increase in mentions of reopening on museum websites between March and November 2021, for local authorities, independent not-for-profits, and private museums.
% of museum websites mentioning current opening

Local authority museum websites (orange line) show the largest increase (from 44% in March 2021 to 56% in November 2021), which suggests that they are more likely to have reopened than the other two groups. The increase can be seen as early as April, which may reflect websites updating in anticipation of full reopening in May 2021. The change in April may also reflect the reopening of outdoor facilities across the UK that month, prior to full reopening in May. Independent not for profit museum websites (green line) show a smaller change (from 41%, to 49% by August 2021), and private museums (blue line) changed by a similar amount (from 36%, to 45% by November 2021).

Over the same period, museum websites decreasingly mentioned that they were closed.

A chart showing a gradual decrease in mentions of closure on museum websites between March and November 2021, for local authorities, independent not-for-profits, and private museums.
% of museum websites mentioning current closure

The chart above shows the percentage of websites mentioning current closure between March and November 2021. The biggest drop is for local authority museums (from 77%, to 59% by August 2021), which again suggests that they are more likely to have reopened. That decline was slightly less on websites of independent not for profit museums (from 65% to 49% by September 2021). Private museums show the smallest change (from 49% to 44% by September 2021). This could suggest that private museums are least likely of the three groups to have reopened, but the chart of reopening above suggests that they were similar in this respect to not-for-profits.

Whether considering mentions of opening or closure, our summary website data suggests that local authority museums were the most likely to have reopened of these three groups of museums.

That finding is borne out by manually checking samples of the text we found on museum websites. In April 2021 – before lockdown was lifted – we found that 231 local authority museums explicitly stated that they were closed due to Covid, compared to 318 independent not for profit museums and 45 private museums.

By September 2021, four months after restrictions had been relaxed, we found that just 38 local authority museum websites still stated they were closed due to the pandemic, a reduction of 84% from April. By comparison, 72 not for profit independent museums still stated this, a smaller reduction of 77%. For private museums, 10 websites still stated they were closed due to the pandemic, a reduction of 78%. So this analysis also suggests that local authority museums were more likely to have reopened, while private museums and not-for-profits show lower rates of reopening.

These figures must be seen as approximate, given that not all museum websites are updated regularly and our search tools are far from perfect. But both types of analysis suggest that local authority museums were more likely to reopen after lockdown than the largest groups of independent museums.

Mark Liebenrood

Categories
Research Process

Upload!

Fiona Candlin

On Friday 26th January, the Mapping Museums project reached the end of its first phase, and for us, it felt like a momentous date. For the last fifteen months Dr Jamie Larkin and I have been compiling a huge dataset of all the museums that have been or were open at any point between 1960 and now. That information has now been finalised and handed over to the computer science researcher to be uploaded. In the coming weeks, we will be able to start analysing our material and generating findings about the past sixty years of museum practice in the UK.

The dataset of museums synthesises information from a wide variety of different sources. We started with DOMUS (The Digest of Museum Statistics), which was a huge survey of museums conducted in the mid 1990s and with the 1963 Standing Committee Review of Provincial Museums. These captured a large number of museums that were open in the mid to late twentieth century, but have since closed. We then added current records and information from the Arts Council England (ACE) accreditation scheme, and from the national records gathered by from both Museum Galleries Scotland (MGS), and the Welsh Museums Libraries Archives Division (MALD) and the Northern Ireland Museums Council (NIMC), since these lists both include non-accredited venues museums. The Association of Independent Museums (AIM) gave us a list of the museums that have been members their membership records and we also managed to find the results of a very old survey that they had conducted in the 1980s in the University of Leicester Special Collections library. This was research gold for it identified very small museums that are extremely difficult to trace once they have closed.

We included around half of the historic houses that are listed in the Historic Houses Association guidebook, and a number of properties that are managed by English Heritage, Historic Environment Scotland, or CADW. Deciding which venues reasonably constituted museums was a difficult process and one that we did in consultation with senior managers and curators of those associations, colleagues from the Museums Development Network and with the ACE accreditation team, although the final decisions were our own.

In the course of researching my last book Micromuseology: an analysis of independent museums, I had compiled a list of very small idiosyncratic museums, and these were added into our rapidly growing list, as were a surprisingly long list of museums that were listed online but not in any of our other sources. We then checked our dataset against the Museums Association ‘Find A Museum Service’ and against two huge gazetteers The Directory of Museums and Living Displays and The Cambridge Guide to the Museums of Britain and Ireland edited by Kenneth Hudson and Ann Nicholls in 1985 and 1987 respectively. Finally, we also consulted the Museums Association Yearbook at five yearly intervals from 1960 until 1980 and also a variety of publications that listed historic houses that were open to the public. In all cases, any venues that we had previously missed were added.

Having established a long list of museums we needed to ensure that we had a correct address, and the opening and closing dates for each venue. We also wanted to establish its governance, whether it was national, local authority, university, or independent, and if the later, if it was managed by a charitable trust or by a private group. Finding this information necessitated months of emailing and telephone calls, and we often ended up speaking to the children of people who had founded museums, or to members of local history associations in the relevant area. Even so, the process of compiling our dataset was not yet finished for we also needed to classify each museum by subject matter. In order to do this we devised our own classification system and considered each venue on an individual basis. It is little wonder that major museum surveys are infrequently undertaken.

The next phase of the research is analysing the data, so watch this space for updates. The first findings on museum opening and closure will be presented at ‘The Future of Museums in a Time of Austerity’ symposia at Birkbeck on February 24th 2018. We will also be tweeting about interesting aspects of our analysis, so don’t forget to follow us @museumsmapping on twitter.

Copyright Fiona Candlin January 2018.

Categories
Research Process

Surveying museums: What’s in and what’s out?

We began the Mapping Museum research by investigating the numerous surveys and reviews of UK museums that have been compiled since the 1960s. Our intention was to use that material as the basis for our own dataset, but it gradually became clear that the various government and charitable bodies who had conducted the surveys or collated the lists did not always include or exclude the same venues. They all had subtly different ideas of what a museum was.

Clearly, the motivations for surveying museums vary depending upon the remit of the association or body that is conducting the survey. If a review is focused on state support then there is little reason in spending time and money investigating independent museums, art galleries without collections, and examining regimental collections would be pointless if the survey is meant to look at the role of university museums. It is not that the surveys have been inaccurate, or that we should advocate for a more perfect overview, rather that they are designed for particular purposes within specific contexts. Even so, the selectivity of a survey does matter, especially when they concern museums in general. In adopting one set of terms over another, or in deciding that a particular category of venues do or do not fall within their purview, surveys diverge in how they constitute museums. They have each understood museums to be slightly different entities, and this has an impact on how they portray the sector as a whole.

In this and the next two posts I will consider some of the types of venues that have been included or excluded from surveys, and as they are the main focus of our study, I will begin with independent museums.


Independent museums: In or Out?

In 1963, the Standing Commission stressed that they had considered ‘museums run by every sort of authority’. They listed local authority museums, those run by the Ministry of Public Buildings and works (which later became Historic Buildings Commission, then English Heritage), military, school and university museums and finally ‘privately-run museums’ of which a few belong to commercial firms, some to local learned societies, and almost all the rest …. are administered by trusts’. At this stage, who ran the museums, under what governance, and with what degree of professionalism, was less important than the fact they were a museum, and what constituted a museum was not raised as a question. Surveys conducted in the 1970s and 1980s were similarly inclusive but that situation had changed by the 1990s.

The shift in approach was motivated by an increasing emphasis on professionalization and specifically accreditation. In 1971 the Museums Association proposed a voluntary accreditation scheme, which would set basic standards in the sector. In order to be accredited, museums had to comply with the association’s benchmarks and with their definition of a museum. Responding to the plan, which was presented at the Museums Association Annual General Meeting, one speaker observed that many small independent museums would find it difficult to meet the first essential minimum requirement, namely, that they had sufficient income to ‘carry out and develop the work of the museum to satisfactory professional standards’. More than that, the accreditation process introduced a definition of a museum for the first time, and as the speaker also commented, it referred to museums as institutions, which the small independent venues were not.

Initially accreditation was voluntary and was run in a relatively ad-hoc way, but in 1984 it was taken over by the Museums Libraries Archives Council and became more closely connected to funding. Museums had to be accredited in order to qualify for public support and so membership of the scheme became increasingly ubiquitous. It also began to be used as the basis for surveys and lists. DOMUS, which was the most comprehensive survey of museums in the UK, only included accredited institutions and omitted an estimated 700 non-accredited museums. At one point the DOMUS team did consider the possibility of including non-accredited museums and of generating a more comprehensive view of the sector but it came to nothing, not least because the survey data was gathered in tandem with the annual accreditation returns, and so there was no process for collecting information on these additional museums.

The situation, wherein small independent museums did not meet the requisite standards and therefore were largely absent from official data, was exacerbated when the definition of museums changed in 1998. The new definition added a legal stipulation, which was that museums had to keep their collections ‘in trust for society’. Again, this concerned the contract between museums and the public because establishing museums as trusts helps ensure that collections are not sold or used for private gain, which is especially important when funding is involved. The result was that from this point onwards any museums that were run on an ad-hoc basis with little official governance, were constituted as commercial enterprises, or were owned by families, individuals, or businesses, ceased to appear in official data. Likewise, museums that did meet the terms set by the Museums Association definition, but had decided not to seek accreditation fell off the official lists.

The Museums Association definition works well as an aspirational target or a guide for professional practice, but it does not describe museums in the world at large. Similarly, accreditation is a useful means of ensuring some accountability with respect to public funding, as is the stipulation that museums should have particular modes of governance. National funding bodies do need to keep track of the museums that have been accredited and are eligible for state support. Nonetheless, using accreditation as a mechanism for collecting information about museums has resulted in a skewed view of the sector. Surveys are structured in such a way that they can only encompass museums that have achieved a particular level of professionalization.

To draw an analogy, imagine that a professional association of musicians declared that music needed to be made within a certain legal context and to be of a certain standard in order for it to count as such. The outputs of community choirs, folk musicians, pub bands, would no longer qualify as music unless they had established themselves as trusts. Yet, in the case of museums, such a definition has been widely adopted and implemented. The museum equivalents of pub bands do not appear in official surveys. In consequence, they do not figure in accounts of the sector or to a large extent in academic histories of museums. It is, as if museums only operate within the sphere of official culture.

Interestingly, some unaccredited museums appear in the Museum Association Yearbooks and more recently on their online Find-a-Museum Service. Although the Museums Association has been one of the main drivers in setting standards and establishing definitions of museums, they are also reliant on membership fees for income. Anyone who pays to join can submit their details, and the Association do not police entries according to their own criteria, since that would result in a drop in revenue. There is some irony in this situation. The Museums Association’s work on establishing definitions has resulted in smaller museums being excluded from official consideration but nonetheless its publications and website are among the few places where non-accredited museums are listed. The Mapping Museums team has used and is greatly extending that data on unaccredited museums, and will be publishing lists of museums in general, not just those that meet professional criteria.


© Fiona Candlin November 2017