Categories
Museum Closure in the UK

Trains, planes, and automobiles – how much do we know about where collections go?


The Mapping Museums Lab have been collecting data on over 450 closed museums, including what happens to their collections and buildings. As we gather information about collections, we’re learning that the data available varies widely from one museum to another. In some cases we’ve obtained a list of where every exhibit went, with the type of destination (such as a museum or private storage facility), and sometimes the state of repair of individual objects. In other cases, we have gathered little more than that the collection was sold, often at auction, and dispersed into private hands.

We’re in the relatively early stages of a two-year project, but some patterns are already starting to emerge. For instance, legal processes can have the effect of producing better public documentation for collection dispersals. Liquidators managing company insolvencies produce annual reports, which detail the disposal of assets, and a set of those reports were produced when the parent charity of the Yorkshire Waterways Museum went into liquidation. A more controversial example is the British Empire and Commonwealth Museum, where accusations of impropriety led to numerous news reports that documented the complex trajectories of some of the exhibits. Although Bristol Museums now look after the bulk of the collection, the whereabouts of some items formerly held by the BECM are still unknown.

The type of object displayed can make a big difference to the amount of information available. Museums of aviation and railways, which in the cases we’re looking at often display a fairly small number of large objects, are particularly well documented. One example is the Electric Railway Museum, which was a collection of locomotives, electric multiple units and related items, sited near Coventry. The museum’s founder kindly supplied us with a detailed list of the whereabouts of the collection, and the ownership status of each object.

Multiple electric locomotives and rolling stock. A shed is visible on the right hand side.
The Electric Railway Museum in 2012. Photo: Fairfaithfull on Wikimedia Commons

The collections of closed aviation museums can also be fairly straightforward to track. Each plane, in addition to having a manufacturer and model, also has a unique identification number that enables its whereabouts to be found. I have never needed to visit the Demobbed website before starting this project, but that database of former military aircraft has proved invaluable in tracking down some of the planes that were held by now-closed museums. Demobbed features extensive lists of aircraft locations maintained by the Wolverhampton Aviation Group, who are evidently a dedicated community of enthusiasts. Each plane’s history is detailed, including whether parts of it, such as nose cones, were removed and dispersed.

Museums featuring ships and boats have also been relatively easy to track. The small collection of five ships and submarines once held by the Warship Preservation Trust in Birkenhead has been exhaustively documented. This is partly due to a museum and a heritage organisation acquiring two of the vessels. But thanks to enthusiasts keeping an eye on the others, documenting them online and sometimes campaigning for their preservation, we know that a submarine and the frigate HMS Plymouth were scrapped, while the last known destination of the minesweeper HMS Bronington was a dock in Birkenhead, where it had partially sunk at its moorings.

But for another maritime collection there is more uncertainty about destinations. The large collection of boats at the Eyemouth Maritime Centre was sold at auction in 2017. The sale attracted a fair amount of attention from boating enthusiasts, which means that we have been able to track the destinations of quite a few of the boats. However, around 100 boats were reportedly purchased by a collector and cut up to enable transportation to China. This shipment was apparently intended for a new maritime museum but we don’t know whether it ever opened, leaving the whereabouts of a substantial part of the Eyemouth collection unknown.
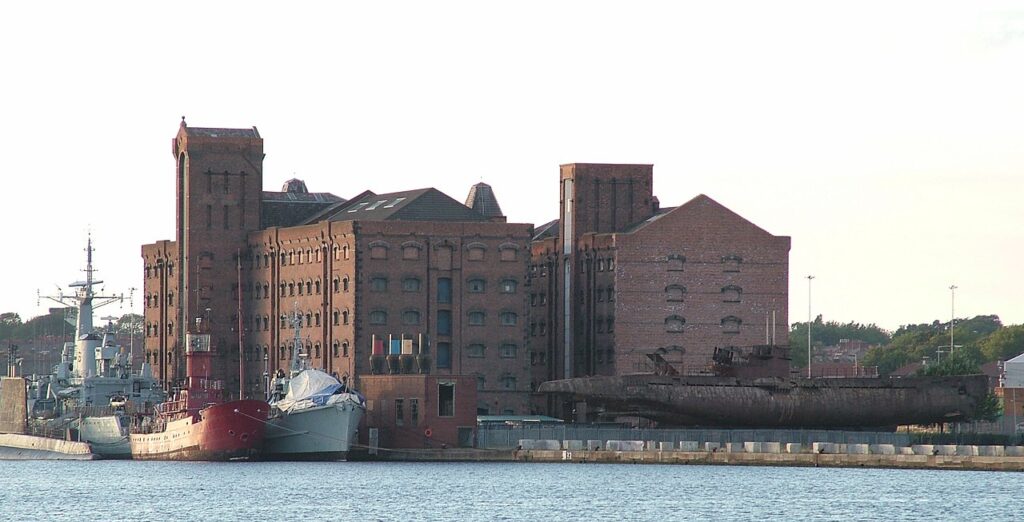
Warships and a U-boat moored in Birkenhead Dock.
Warships Preservation Trust. Photo: Chowells on WikiMedia Commons.

Although planes, trains, and ships have been easy enough to track down in many cases, car and motorcycle museums are another matter. So far, we’ve found that many of these collections go to auction and are subsequently dispersed to private buyers. Occasionally it’s possible to discover that some items have gone to museums, but not always which ones. The auctioneers of the London Motorcycle Museum told us that three of the bikes had been purchased by museums, but our enquiries have not revealed precisely where they went. The case of the Cars of the Stars museum, mentioned in a previous blog, where the collection went to just one buyer who also runs a museum, appears to be quite unusual. As the destinations of auctioned items are rarely reported, that type of museum dispersal is often the end of the trail for us.

A tug painted in bright blue and yellow moored at the dockside.
Wheldale at Yorkshire Waterways Museum in 2005. Photo by George Robinson on WikiMedia Commons.

As our research continues, it’s becoming apparent that although some collections are very well documented, sometimes down to the level of individual items, in many cases we are simply recording groups of items as moving from a closed museum. And it’s unfortunately quite likely that we will never know what has happened to many others, with the destinations of items and even whole collections left unrecorded. Those differences in what we can find out have implications for how we analyse our data. We don’t want to over-represent some collections in our analyses simply because we have more details about them, or under-represent others that are less well documented. As a team we’re continuing to discuss how best to grapple with that problem.

Mark Liebenrood

Categories
Museum Closure in the UK

Museum closures and deprivation

Are museums more likely to close in areas of higher deprivation? It seems an obvious question. The more deprived an area is, the less capacity the council has for raising revenue from business rates and council tax, and the more likely it is to have to cut non-statutory services, such as museums. Meanwhile independent museums in deprived areas might struggle due to the lack of disposable income. Except that turns out not to be the case.

In the last blog we considered closure according to region, which provided us with an overview of museum geography in the UK. In this blog we take a more granular approach and draw on the Index of Multiple Deprivation. This is the official measure of relative deprivation in the UK and is assessed on a combination of household income, employment, education, health, crime, barriers to housing and services, and living environment. Using the index allows us to look at deprivation in relation to small areas with around 1,500 residents apiece, which then enables a more nuanced understanding of where museums are located and the types of places where closure occurs. Deprivation is calculated differently in Northern Ireland, Scotland, and Wales, making comparisons difficult, so in this blog we focus only on England.

Table 1 shows the distribution of open museums across England as of the beginning of 2024. They have been classified according to governance and the deprivation of the ward in which they are located. As you can see, all kinds of museums can be found in almost all areas – irrespective of deprivation. There are no national museums in the least deprived areas and no university museums in the most deprived, although both these types of museums have relatively small numbers. Most notably, private, and independent (not for profit) museums cluster in the middle ground, while local authority museums tend towards the most deprived.

Table 2 shows change in the number of museums since 2000 and gives the percentage change in each category. As we outlined in our previous blog the number of independent (not for profit) and private museums rose since 2000. Here we can see that the expansion in numbers of not-for-profit and private museum goes across the spectrum of deprivation with large growth in the middle.

The number of Local Authority museums has decreased since 2000 but there has been less decrease in the middle ground. There has been a greater decrease in the number of Local Authority museums at the edges of the spectrum, that is in areas of most and least deprivation.

There are two important caveats to this data. Firstly, the Index of Multiple Deprivation does not equate to average affluence or poverty. Rather it looks at most and least deprived, which is slightly different. So for instance, one area may contain pockets of extreme wealth and considerable deprivation, whereas another may be less affluent but also have little deprivation in the sense that residents are all in employment, there are low rates of crime, and so on. According to the Index the first area is more deprived – there is some deprivation amid the wealth – while the second is less deprived.

The second caveat is that a museum’s location is not synonymous to the visitor catchment area. These small areas represent the immediate geographic context in which a museum is sited and visitors may come from much further afield. The degree to which they do so depends in part on the type of museum in question; whether it is a national, regional, or small local museum. Going forward we will be thinking further about calculating the distribution of museums and change according to the visitor catchment area.

Yet despite the caveats, the data shows that change in the sector does not neatly align with levels of deprivation. We cannot link museum closure to deprivation or indeed growth in numbers to a lack of deprivation.

Fiona Candlin
George Wright
Andrea Ballatore

Photo: Katy Pettit

Categories
Museum Closure in the UK

New data on UK Museum Closure 2000–2024: Governance and region

At least 467 museums have closed in the UK since the beginning of the millennium.1 For organisations that aim at keeping their collections for posterity that figure may seem high, but it is important to realise that for most of the past twenty-four years, more museums have opened than closed. The sector is still bigger now than it was in 2000. The more pertinent question is which types of museums have closed and where? Are parts of the sector thriving while others struggle? When did they close: are we on an upwards or downwards trajectory or is the sector flatlining? Over the next few months, we’ll address all these questions. In this blog we’ll concentrate on governance, looking at the differences between governance types, and if those are nuanced with respect to region.

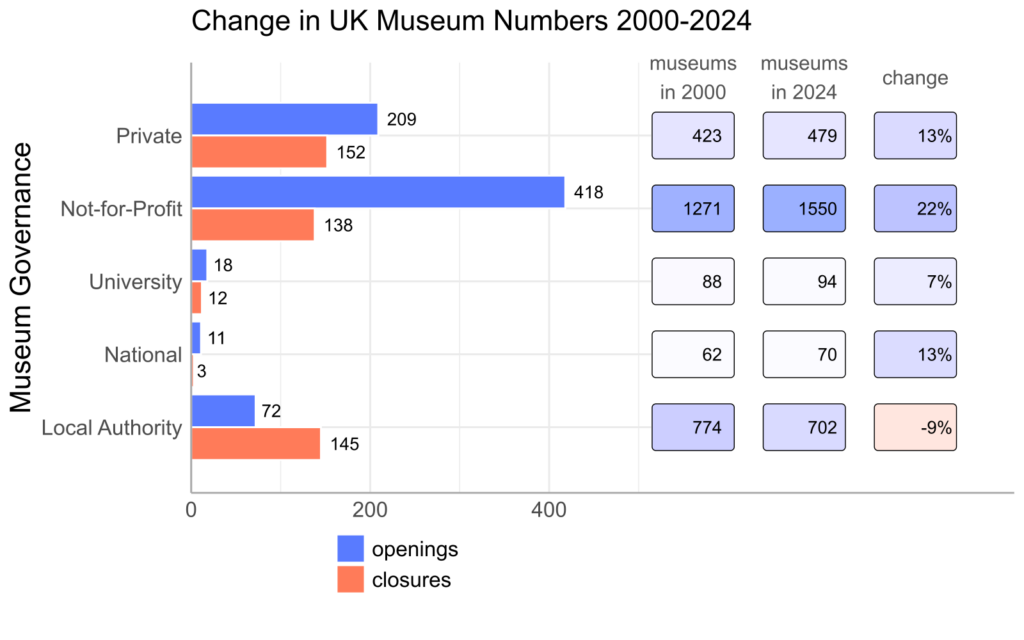
Table 1 shows that around 138 independent (not for profit) and 152 private museums definitely closed during the period under study. Those numbers are far outweighed by openings. Since 2000 some 418 independent (not for profit) and 209 private museums have opened, which more than offsets the numbers of closures. There are far fewer university and national museums, but like not-for-profit and private museums, their overall numbers have also risen. Twelve university museums have closed and eighteen opened, and three national museums or additional branches have closed with eleven openings. In terms of overall numbers at least, the private and independent (not for profit) museum sectors have collectively managed to ride out waves of austerity, the pandemic, and the cost-of-living crisis. The same is not true of local authority museums, 145 of which have closed with only 72 opening, a loss of 73 museums.

It is easier to grasp what is happening in the museum sector if we frame openings and closures in terms of percentage change. That approach takes the numbers of closures and openings for each group of museums into account and judges them against the total number of museums in that category. Looking at Table 1 we can see that the overall number of independent (not for profit) museums has risen by a substantial 22%, private and national museums by around 13%, and university museums by 7%. In stark contrast, the change for local authority museums is -9%.

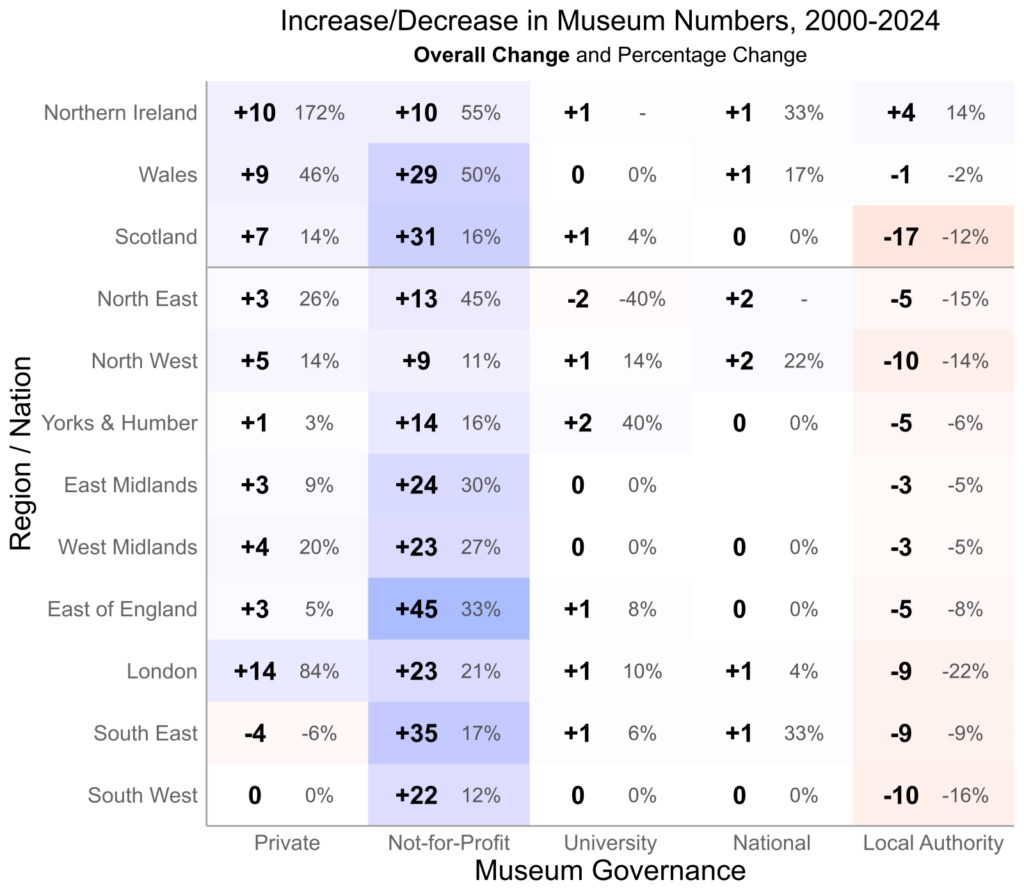
So where exactly are these museums opening and closing? Table 2 shows us that growth among independent (not-for-profit) museums, has been spread across all the nations and English regions regions most notably Wales, Scotland, and the East of England. Conversely, the number of Local Authority museums has decreased in all regions, the exception being Northern Ireland (where the museum sector has consistently had different patterns of growth and closure to the rest of the UK). The dropping numbers of Local Authority museums is the most worrying aspect of museum closure over the last twenty-four years. Scotland lost by far the most local authority museums, with a drop of seventeen since 2000, that is, 12% of its total. However the situation is perhaps more troubling in London which lost nine local authority museums, a decrease of 22%, the largest in the UK. Although the capital is well served by national museums, they are mainly located in the centre of the city and serve a national and international audience, whereas the Local Authority museums are mainly in the outer boroughs and are usually conceived as a service for the neighbourhood.

We also want to point to the areas that have low growth among independent museums and have simultaneously lost a higher proportion of Local Authority museums – particularly the North West. In these areas, the overall levels of museum provision, and hence the benefits that they may provide in terms of access to public space, informal education, culture, and just pleasure, are being correspondingly reduced.

In our next blog we will be looking at social deprivation and exploring the issue of closure and access to museums in more detail. Please subscribe to receive further posts on our work in progress and new findings.

Fiona Candlin and George Wright

  1. A note on numbers:
    In most cases, we have a definite year for museum closure. In some cases, we have a date range. For example, we may know that a museum closed at some point between 1995 and 2005 but cannot determine exactly when. In these instances, we calculate the probability of it having closed after 2000 and factor that information into the analysis. That can lead to some slight discrepancies in the totals, for instance when one number is rounded down and another rounded up. Apart from the headline number of 467 definite closures since 2000, all the data reported in this post are based on probabilistic estimates. Our best estimate of the total number of closures is 534. ↩︎
Categories
Lab News Publications

Mapping Museums data used by ONS

The Office for National Statistics (ONS) used Mapping Museums data in a new analysis of public access to sports facilities, supermarkets and museums.

Of museums, they write:

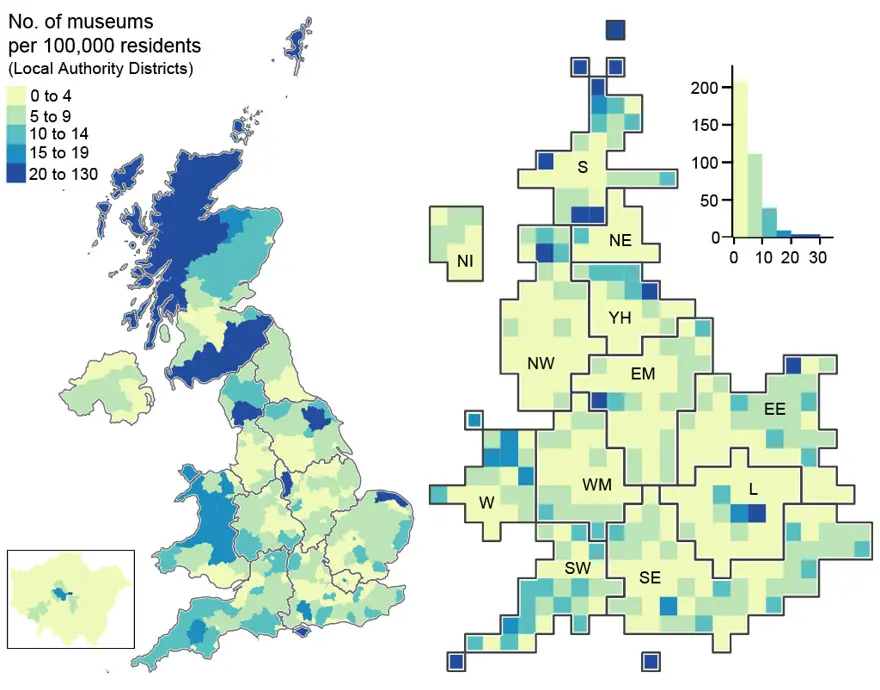
Urban areas, in particular large cities, have fewer museums relative to their population than rural areas. Seven of the ten local authorities with the fewest museums per 100,000 people in the UK are London boroughs. Those local authorities with the higher proportion of museums tend to have small not-for-profit local history museums.

https://www.ons.gov.uk/peoplepopulationandcommunity/wellbeing/articles/moreadultsareactiveinareaswithahighernumberofsportsfacilities/2024-03-07

The new release includes a report and four datasets, including the number of museums across Local Authority Districts (LAD) in the United Kingdom.

Categories
Lab News Publications

Museum Maps at the Royal Geographical Society

The Royal Geographical Society (with IBG) has selected our museum mapping work as an example of notable geo-visualisations.

‘The visualisations created show huge geographical inequalities in the sector, with some areas attracting a lot of museums and others very few.’

Read more here: https://www.rgs.org/about-us/what-is-geography/geovisualisation/mapping-museums

Categories
Museum Closure in the UK

The afterlife of museum collections

What happens to collections after museums close? Over the next two years the Mapping Museums Lab will be looking at that question in more detail, but even in these early stages of the project we’re beginning to get a sense of some of the outcomes and of the objects’ destinations.

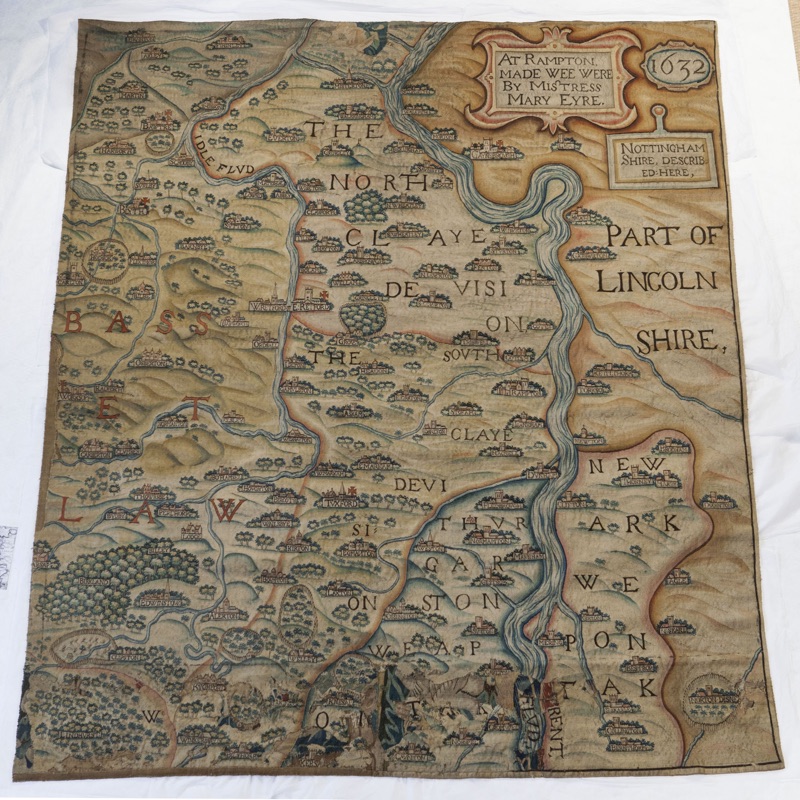
We’re concentrating on museum closure in the UK since 2000 and so far, museums’ governance seems to make a significant difference to where objects end up. The collections from local authority museums are generally returned to or absorbed into the county or city service, and often re-appear in other spaces and exhibitions. For example, the Nottingham City Museums service operated multiple sites including The Museum of Costume and Textiles [1976-2003]. After it closed to the public, the collections were stored onsite, then re-located to the historic house Newstead Abbey, with some items later going on exhibition in various other museums within the service.  Among other things, two seventeenth-century tapestry maps of Nottinghamshire, which had been on permanent display at Museum of Costume and Textiles, and were stored following its closure in 2003, were prominently displayed in the “Rebellion” themed gallery at Nottingham Castle when it reopened in 2021.

A tapestry map of part of Nottinghamshire. It is dated 1632 at the top right and a cartouche contains the words 'At Rampton made wee were by Mistress Mary Eyre'
A 17th century tapestry map of Nottinghamshire

We found similar trends in other local authority museums that closed. Artefacts from St Peter’s Hungate Church Museum [1933-2000] reappeared in the decorative arts galleries at Norwich Castle and in the period rooms at Norwich Museum at Brideswell, museums operated by the same local authority. The Manor House Museum [1993-2006] in Bury St Edmunds had a collection of fine art, costume, and perhaps most notably clocks, which went to their sister institution Moyse Hall.  The costume and art are incorporated into social history displays as and when they are required, while the clocks have a permanent space.

In a few instances the local authority mothballs a museum leaving everything in situ. In some cases, this allows for some continuing use. The Museum of Lancashire [1972-2016] in Preston has been closed for several years, but the galleries with recreated spaces – a Victorian classroom and street scene, and a World War 1 trench – and all the associated objects remain untouched and are regularly used for education sessions. When I first spoke to staff in November 2023, hundreds of schoolchildren had been through the otherwise closed museum in the previous weeks. Moray Council took a more drastic approach when it shut the Falconer Museum in Forres [1871-2019]. The collections in the store and displays in the public galleries remain as they were left when the staff left on their last day, and the only people who have access are the conservation officers responsible for checking the building and collections.

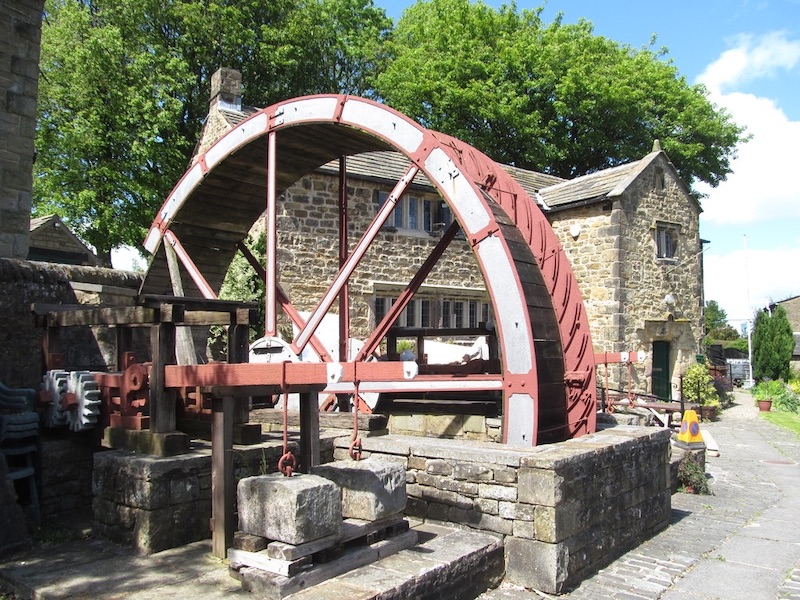
So far, we have not found any independent museums that mothball their collections. In some cases, the trust or organisation that ran the independent museum still exists and they retain ownership of the artefacts, loaning them out to other organisations. For instance, the instruments from the Asian Music Circuit Museum [1998-2014] are on long-term loan to the Music department at York University, although it is not clear whether they will ever be returned. In other cases, the collections are transferred in their entirety to another museum. When the independent Bexhill Costume Museum [1972-2004] faced closure early in the millennium, the director negotiated a complete transfer of collections to Bexhill Museum, which was accordingly redeveloped with support from the local authority, re-opening in 2007. Likewise, the contents of Earby Lead Mining Museum [1971-2015] went wholesale to the nearby Dales Countryside Museum, which was local authority run.

A view of the exterior of Earby Lead Mining Museum. A large oxide red metal wheel dominates the foreground and a two storey stone building stands behind.
Earby Lead Mining Museum (photo: Gordon Hatton)

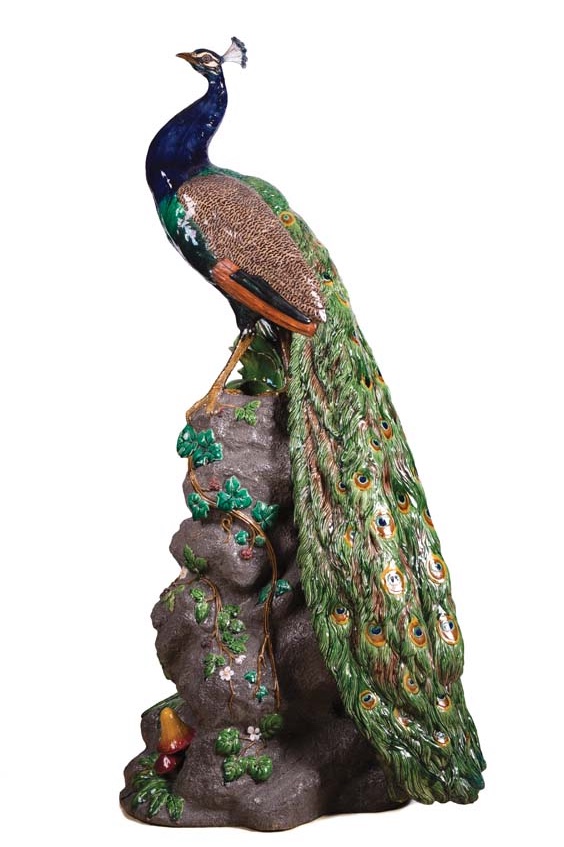
The collections from the private museums that we have so far researched are frequently sold, often at auction. Occasionally we know who bought the objects. The Cars of the Stars Museum in Keswick, which included vehicles featured in James Bond films, was purchased in its entirety by Michael Dezer who relocated the collection to his museum in Miami, Florida. When the company museum at the entrance to the Minton factory closed [1950?-2002], the Potteries Museum in Hanley bought a 4ft tall ceramic peacock that had stood at the entrance. More usually, these objects disappear into the anonymity of the private sphere.

A ceramic peacock made by the Minton firm. The peacock looks up to the left and stands on a tall rock with its tail feathers draped down the right hand side, reaching the ground. Ivy and other plants decorate the exposed rock surface
The Minton Peacock. Image courtesy of The Potteries Museum & Art Gallery, Stoke-on-Trent

Researching closure is a slow and painstaking task and it will be several months more before we begin to have a more rounded picture of what happens to museum collections. It may be that our observations will be revised in the process. They will certainly be developed and refined. Over the next few months, we will be exploring numerous topics related to museum closure: which objects get scrapped, the emotional aspects of closure, and the possible corelations between social deprivation and dispersed collections. Do subscribe to our blogs on this new website for updates on our progress.

Fiona Candlin

Update: this blog was updated on 12 March 2024 to correct the status of Bexhill Museum.

Categories
Lab News

Funding success for the Mapping Museums team

We are pleased to announce that the Arts and Humanities Research Council has awarded £1million to the Mapping Museums research team for their project ‘Museum Closure in the UK 2000-2025’.  

The new research will use trans-disciplinary methods to analyse closure and collections dispersal within the UK museums sector. Its aim is to examine the geographic distribution of closure, to better understand types of closure (e.g., whether museums are mothballed or disbanded), and to document the flows of objects and knowledge from museums in the aftermath of closure. We will investigate the afterlife of collections, find out if museum exhibits are scrapped, sold, stored, or re-used, and examine ‘outreach’ and temporary museums. A Knowledge Base will be designed to model and store the collected data, and visualisations and analyses of the data will be developed. Above all, we aim at critically reassessing notions of permanence and loss within the museums sector.  

‘Museum Closure’ is based at Birkbeck, University of London and at King’s College London, and will run for two years, beginning in October 2023. It is led by Fiona Candlin, Professor of Museology, who will be working with co-investigators, Dr Andrea Ballatore (King’s College London), a specialist in cultural data science, Alexandra Poulovassilis, Emeritus Professor in Computer Science, and Peter Wood, Professor in Computer Science. The post-doctoral researcher is Dr Mark Liebenrood (museum history) and we will be recruiting a second post-doctoral researcher in data science.

(Image modified from original, by elston on Flickr)

Categories
Publications

Letter on Museum Closure

Our researcher Mark Liebenrood recently wrote a letter to The Guardian about museum closures. His letter is below, or you can read it on the Guardian’s site with other letters about the value and plight of museums in Ukraine and Sudan.

Charlotte Higgins is right to highlight the straitened circumstances of the UK’s museums (War has shown Ukrainians – and the rest of us – why museums are so important for telling our stories, 27 May), but there are deeper issues in the sector than a lack of cash to modify working practices and maintain displays.

The Mapping Museums project at Birkbeck, University of London has shown that more than 800 museums have closed in the UK since 1960. There can be many reasons for museums to close: founders retire, land and buildings are lost when leases cannot be renewed and, yes, reductions in income. But lack of funding is often a result of political choices. It is probably not by chance that the rate of closures has accelerated since 2010 – a period that coincides with austerity policies, with all their ramifications.

New museums have continued to open regularly, but 2010 was the first time that closures outstripped openings, and there are now signs that the sector may have begun to shrink. As Higgins says, we need museums. Closures often mean loss of access to collections, and in turn to public history. That too is a crisis that needs attention.

Categories
Museums in the Pandemic

Was there a ‘swing to the digital’? Museums and social media in the pandemic

In the course of the pandemic there were reports of museums boosting their online activity. ArtFund’s 2021 report (download) on the impact of COVID-19 noted most of the respondents felt they had ‘made a significant leap forward’ in relation to digital engagement, and anticipated further development in the future. 

The Network of Museum Organisations (download report) and the International Council of Museums (download report) also reported that an overwhelming majority of survey respondents had increased their online presence during museum closures. Social media was cited among the most popular tools for digital audience engagement during the pandemic. 

Our team collected open social media data covering the period between January 2019 and May 2022, to see how the pandemic has changed the way that UK museums use two platforms – Twitter and Facebook. 

Our findings challenge the received view: they suggest there was no sustained increase in social media use on these platforms as a result of the pandemic. 

We found that COVID-19 restrictions had an immediate two-fold effect on museums’ social media activity. On the one hand, we observed a fall in the number of active museum social media accounts between April 2020 and May 2021. Most of these museums had registered an account before the COVID-19 crisis, as new registrations made up less than 1% of active users. 

On the other hand, the museums that remained active posted more than before the pandemic. This spike was temporary, however, with activity returning almost to the pre-pandemic level after the first national lockdown (26 March – 04 July 2020), even dipping below it after restrictions were lifted. 

First Lockdown – Breaking old patterns of activity 

Let’s look at those findings in more detail. We analysed social media trends using two metrics: the changing number of museums active on social media, and how many social media posts they produced. We considered a museum account active in a given period if it posted at least one message. A fall in the number of active museums did not necessarily correlate with a fall in frequency of posting, and vice versa. When the pandemic emerged and after the end of restrictions, the two metrics behaved particularly differently. 

A graph showing UK museums active on Facebook and Twitter, 2019–2021. The vertical axis shows the number of museums and the horizontal axis shows the years and months, from January 2019 until January 2022. The line for Facebook activity starts at roughly 1775 museums and ends at roughly the same level. Below is the line for Twitter, which starts at roughly 1650 museums and ends at roughly 1450. For both, activity peaks in April 2020, during the first UK lockdown.

Both platforms saw a comparable decline in active users a week after the restrictions were announced in March 2020 and this measure remained low throughout the entire period of restrictions. The lowest active user rates occurred during the first and third national lockdowns – March to July 2020 and January to May 2021. 

Although the number of active users plummeted in the first lockdown, the ratio of tweets and Facebook posts per active museum actually became higher than in 2019. 

A graph showing UK museum social media posting activity on Facebook and Twitter, 2019–2021. The vertical axis shows the number of posts or tweets and the horizontal axis shows the years and months, from January 2019 until January 2022. The line for Twitter activity starts at just under 70,000 tweets and ends at roughly 50,000 tweets. Below is the line for Facebook, which starts at just over 30,000 posts and ends at a slightly higher level. For Twitter, activity peaks sharply in May 2020, during the first UK lockdown, and tails off from there. Facebook ativity is more even across the period, with the lowest level in February 2021.

The second graph shows monthly changes in the overall number of messages posted by museums that remained active. During the first lockdown, when the number of active accounts was particularly low, Facebook posts grew by 20% and tweets by 40% compared to the monthly average number of messages before the pandemic. 

This suggests major variation between museums in their response to COVID-19 on social media. Falling active users indicate that a number of museums used social media less than in 2019, while the museums that remained online were more likely to post more actively than before the pandemic. 

However, this flurry of social media use during the first lockdown was not matched by sustained activity as the pandemic continued. 

Museums using Facebook declined in their activity by the end of the first lockdown. Throughout the rest of the pandemic, museums published on average the same or slightly fewer Facebook posts than in 2019. On Twitter, active museums continued producing more tweets than in 2019 until the end of restrictions. However, after the first lockdown, the difference was less significant. 

After the lockdowns – towards a further decrease? 

Our data shows that there was no clear increase in social media use throughout the pandemic itself, and it suggests that posting activity continued to decline after the restrictions finished. 

By the time restrictions were lifted completely in 2021, tweet and post numbers were lower than they had been in 2019. In 2022, both platforms saw the lowest ratio of posts per museum in the entire studied period. On Twitter, the fall of tweeting activity coincided with a further decline in users. Facebook users, on the contrary, became more numerous but their content volume was the lowest in the entire studied period. 

Thus, claims about museums’ swing to the digital must be treated with some caution. As far as Twitter and Facebook were concerned, there was a broad swing away from the digital. Museums that were already active on those platforms became more so, but that flurry of posting was relatively short-lived. 

Further details on how national lockdowns influenced museums’ social media use and on the differences between the two platforms will be found in our forthcoming social media paper.

Katerina Mityurova

[Photo by NordWood Themes on Unsplash]


Categories
Events

The UK Museums Boom (and what happened next)

The Mapping Museums project is coming to an end. Please join us for the closing lecture:  ‘The UK Museums Boom (and what happened next)’

Thursday 17th November 6pm

Clore Management Centre, Birkbeck, 27 Torrington Square, London WC1E 7JL (Map)

Chair: Isabel Wilson, Arts Council England

Speaker: Prof Fiona Candlin, Professor of Museology, Birkbeck

Respondent: Lisa Ollerhead, Director, Association of Independent Museums

With a drinks reception to follow

Places are free but please book here: Book Tickets

During the late-twentieth century there was a significant increase in the number of museums in the UK. Yet, apart from the highly polemic heritage debates of the 1980s and 1990s, the boom was not investigated in any detail. There was no firm information on its location or character, or indeed on what happened next.  The Mapping Museums project was devised to remedy that situation.

Over the last six years we have collected and analysed data on over 4,000 museums, and conducted detailed interviews with the founders of the new museums. In this lecture Prof Fiona Candlin, the project lead, will outline some of the things we learned.