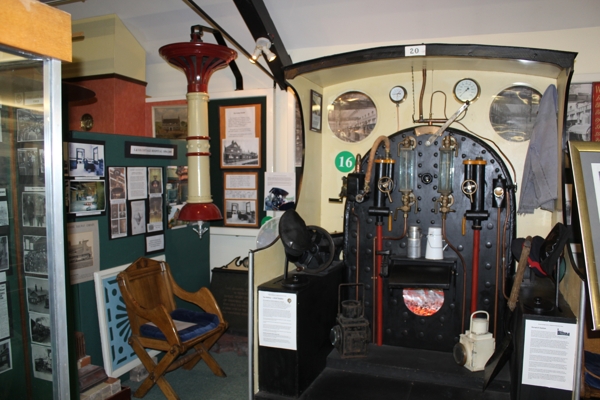
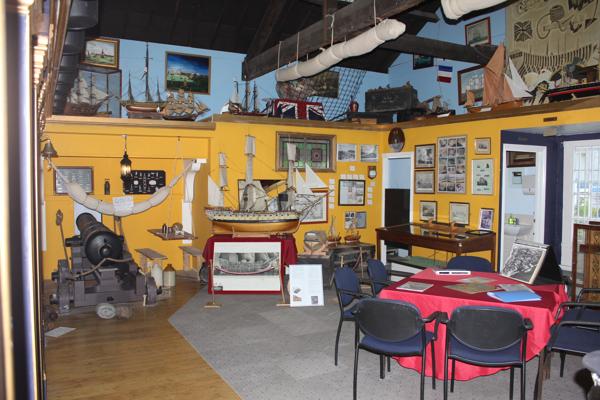
Horwich Heritage Centre is a local history centre in Horwich, a town of 20,000 people near Bolton in Lancashire, on the edge of the West Pennine Moors. The town expanded rapidly in the 18th and 19th century as bleach works, cotton mills and a large railway locomotive works came to the town. The museum first opened in 1995 and is now housed in what was a rifle range, part of an early 20th Century territorial army barracks. The displays cover a range of industrial and social history of the town and the surrounding area. Exhibits include an iron toll gate post, a replica of an engine cab, a scale model of the locomotive works, a huge gas lamp from a cottage hospital and a large collection of models, household items, photographs and ephemera organised thematically on various local history including a Victorian kitchen, domestic life 1900 to 1950s, mining, and transport and wartime history. The museum has regularly updated temporary exhibition space, a research area for local study and a small shop.
Entrance to Horwich Heritage Centre
The Centre is run by Horwich Heritage, a voluntary organisation established in 1985 following the closure of the locomotive works two years before (the works once employed thousands of people). The aim was to set up a history society that would, in part, help to boost the morale of the town and it soon attracted more than 150 members. A small room was offered by the local council to have exhibitions in a community centre that was used for displays for ten years from 1995 to 2005. The Council then offered them tenancy of the current building and it took three months to set up the displays. A range of activities and new exhibitions bring in around 3,000 people a year (the centre is open two hours a day). Horwich Heritage has also been working to save some of the historic buildings in the works, and are developing a heritage trail around the site, and working with the developers on street naming. It has also been actively restoring and protecting local features and details of this work can be found in the news section of their website.
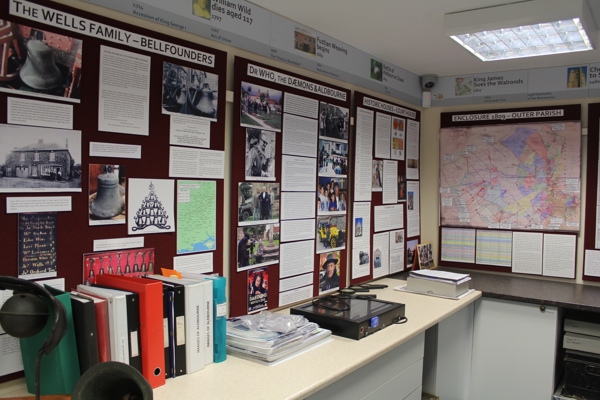
Aldbourne Heritage Centre is concerned with the history and heritage of Aldbourne Village in Wiltshire. It was established by Aldbourne Heritage Group in 2014 and the displays include the Aldbourne Cup, a pottery vessel dating from 1500BC; a collection of bells made in a local bell foundry and various aspects of farming, local industry and the social history of the village. It has a display on the ‘Band of Brothers’ commemorating the history of the nearby Second World War US paratrooper base made famous by an HBO TV series. The Centre also has an extensive archive of 10,000 photographs and hosts regular history talks at the nearby Methodist Church.
Entrance to Aldbourne Heritage Centre
Unusually, the Heritage Centre is situated in converted public toilets, near the centre of the village. The building is stone, brick and tile and was converted to an internet café by a youth group before it became a heritage centre. It is a small, one-room museum with a modern, well-lit and carpeted interior and public toilets are still situated at one end of the building. It is immediately adjacent to a pub with a Dalek outside. A well-known series of episodes of Dr Who (The Daemons) was filmed in the village in 1971 starring John Pertwee in which the Doctor visits ‘Devils End’ to investigate a satanic vicar and discover the secret of mysterious burial mound. A timeline featuring major episodes in village history runs around the top of the room and current displays covered the bell foundry (including bell ringing and a substantial collection of bells); Dr Who and the Daemons; historic houses; enclosure; notable residents of Aldbourne; the inhabitants of Aldbourne in 1809; the Aldbourne Cup, Aldbourne WI and US Airborne in Aldbourne 1943-4. The Centre also has a substantial website including digital records of Rolls of Honour, grave inscriptions and field maps.
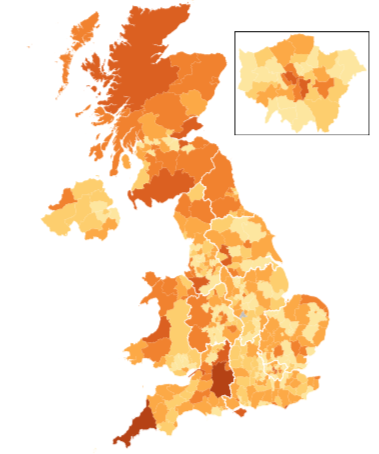
Map of museums growth UK 1960-2017 by Andrea Ballatore
Until fairly recently, I had no idea that organising museums according to their location could be quite so complicated. In the original proposal for the Mapping Museums project, we had stated that we would develop a database that would enable researchers to search our data according to a museum’s location and to visualise that information. For instance, a user could browse through all the museums in Yorkshire or see them marked as points on a map. That seemed reasonably simple. Why, then, did this task keep me awake at night?
I now know that there were three key questions and areas of research, but initially, they blurred into one confusing mass. We needed to decide which boundaries we would use, how the database would be organised with respect to location, and to identify the datasets that would underpin the database and create map-based visualisations. We also had to think about the needs of different users. This blog looks back on why we initially struggled with location and the decisions we made about how to map our data.
Choosing boundaries
The first task was deciding which boundaries we should use to search and map the museums listed in our dataset. The Museum Development Network and Arts Council use regions as the basis for organising support and funding. The Office of National Statistics also uses them in statistical analysis, and so my first thought was to follow that structure. I quickly found information on the nine regions of England and then looked for data on Northern Ireland, Scotland, and Wales, only to discover that for analytical purposes, those three countries are considered to be equivalent to regions. Putting Scotland or Wales on a par with the East of England or the West Midlands seemed to imply that these countries had the same status as a sub-section of England, and hence were insignificant in relation to England as a whole, which was problematic.
Our next approach was to organise our data according to counties. I then discovered that there are various different types of county: historic counties have their origins in the Middle Ages and still form the basis of many contemporary boundaries; ceremonial counties, which are also referred to as the geographic counties, and which are overseen by a Lord Lieutenant; and the administrative counties, which were replaced by metropolitan and shire counties. Given that we are likely to consider the allocation of financial and other resources, it seemed sensible to use the boundaries that relate to Local Authority administration, and so the Mapping Museums Computer Science researcher started to build the map according to metropolitan and shire counties. Unfortunately, when he presented his work, the image had large gaps with no information. It took me some time to work out that, even though counties are commonly referred to in each country, for administrative purposes, Wales is divided into unitary authorities, Scotland’s sub-divisions are known as council districts, and Northern Ireland has local government districts. Thus, these areas did not show up on a map that referenced counties.
The situation becomes even more complicated within England, which is divided into metropolitan and shire counties, and unitary authorities. Greater London is its own entity and does not belong to any of the other groups. Each of those categories then further sub-divides. Whereas the administrative units in Northern Ireland, Scotland, and Wales have only a single tier, England has a more complex hierarchy. Metropolitan counties divide into metropolitan districts, shire counties divide into non-metropolitan districts, and Greater London into London Boroughs. Unitary Authorities do not have sub-divisions at this level. Table 1 makes this organisation clear.
Table 1: Administrative organisation of the UK
The local authority units are differently constituted in the four countries. However, to make the situation more complicated there are different kinds of administrative geographies. Depending on the public service (census, health, postal, electoral, etc.), the territory of the UK is sliced up in different ways, as displayed in Figure 1.
Figure 1: Hierarchical representation of UK statistical geographies
For the purpose of analysis, some geographical entities like counties are widely used by British people to cognise the territory of the UK, but do not cover the entire space, leaving areas with museums unreferenced. Ideally, a useful organisation of the geographic space in this context must meet three criteria:
All territory should be covered
Units should not overlap
Units should be homogenous in terms of a target attribute (size of the resident population or something else).
UK geographies like the Output Areas or the Local Authority Districts are designed to meet these criteria and are therefore suitable for statistical analysis (less so for spatial cognition). Interestingly, the European framework NUTS aims precisely at creating some order in the messy administrative geographies of EU member states, providing a useful way to think about their commonalities and differences across countries, many of which have similarly intricate administrative geographies (while allowing interoperability and harmonisation of statistical data across different countries).
Choosing the appropriate geography for this project was therefore far from a trivial problem, and the most flexible approach consists of supporting multiple frameworks. Our solution was to identify the location of the museum as precisely as possible in terms of latitude/longitude, so that this location can then be used to assign the museum to any geographic unit., supporting different types of aggregation and analysis.
Organising ‘location’ in the database
The heterogeneous and asymmetric structure of the UK’s administrative geography also had implications for how we designed the database. We had originally intended that the search or browse facility for location would be arranged as a hierarchy of descending size or administrative importance. Following my investigations in administrative borders, I realised that there was no consistent hierarchy, and each country needed its own location logic to be defined. How then to proceed?
Throughout the research, the project co-investigator Professor Alexandra Poulovassilis has adamantly argued that we should not simplify complex data when designing the database. The search and browse functions should be able to encompass and manage some of the messiness of organisation in the real world. Accordingly, our menu of location was organised according to the separate hierarchies of the country in question. A drop-down menu shows England, Northern Ireland, Scotland, Wales, Channel Islands and Isle of Man (the latter two entities are Crown Dependencies rather than part of England). Clicking on Northern Ireland, Scotland, Wales shows their district councils, councils, or unitary authorities as appropriate. England subdivides into regions, then into a mixture of unitary authorities, counties and metropolitan counties, with the latter having the further sub-categories of districts. The region of London divides into the City of London and boroughs. Even though it is not symmetrical, this layout has the advantage of using recognisable sub-divisions, and of acknowledging the differences between the administrative geography of each country.
Identifying datasets
Having decided to use an administrative geography and having agreed that we would not attempt to simplify the differences between the four countries, we then needed to find datasets that would facilitate the organisation of our data. Once again, this involved something of a learning curve and I now know that two types of datasets are required. The first correlates administrative boundaries with postcodes (which we’d collected for each museum) and thus links each museum to a district, council area or region as required. The second dataset enables that information to be visualised in the form of a map.
Datasets that contain the coding for administrative boundaries and their visualisations are devised and available from several organisations, most notably the National Offices of Statistics. However, data collection and analysis within the UK is complicated by devolution. In some cases, the datasets cover two countries or even all four, but generally, the datasets relate to the individual countries of England, Ireland, Scotland and Wales, and to use non-computing terminology, these need stitching together.
A further issue arose in that we needed to find a way to map our data, but we also wanted to import other kinds of data to inform our findings, For instance, we planned on importing census data and using that to make links between museums and the geo-demographic contexts in which they were founded. This meant that we had to choose datasets for locations that would be compatible with any datasets that we may use in the future. In short, we needed to know if we would import additional data in the future, and if so what. It was at this point that we realised we needed expert help and were fortunate enough to have Dr Andrea Ballatore a specialist in geographic information science join the team. He advised on how the different datasets could be combined and also recommended that we use the same administrative framework as the Office of National Statistics as this would allow us to cross-reference our data. Since then the process of mapping museums has proceeded much more smoothly.
Administrative and ordinary geographies
The problem of using current administrative geographies is that they are not always in common usage. For instance, I had not previously encountered English unitary authorities and would never think to look for ‘Liverpool City Region’ when I could look for ‘Merseyside’. The database had to support analysis (i.e. link museums to the correct administrative unit in order to generate accurate statistics) and thus we had to use the relevant geographies, but it also had to support spatial cognition (i.e. help users understand where a museum is using their prior knowledge of the UK). Our solution was to introduce a TownorCity field in the search pages. Users could thereby search by administrative area or on a more intuitive basis by towns or cities.
Since our blog entry on building the database, we have held a series of user trials of the Mapping Museums database and the Web Application through which the database is accessed. These trials have given us much useful feedback for improving the system as well as a positive endorsement of the overall development approach. For example, museums experts told us that the system is “useful to anyone wanting to understand the museum sector as this is the closest we’ve ever been to getting a full picture of it”, “intuitive to use”, “the Museum equivalent of YouTube”.
The figure on the left shows the architecture of our system. It has a three-tier architecture comprising a Web Browser-based client served by a Web Server connecting to a Database Server. The database is implemented as a triple store, using Virtuoso, and it supports a SPARQL endpoint for communicating with the Web Server. The system currently comprises some 28,600 lines of Python code, as well as additional scripts consisting of 25,800 lines of JavaScript, HTML pages, and other source files.
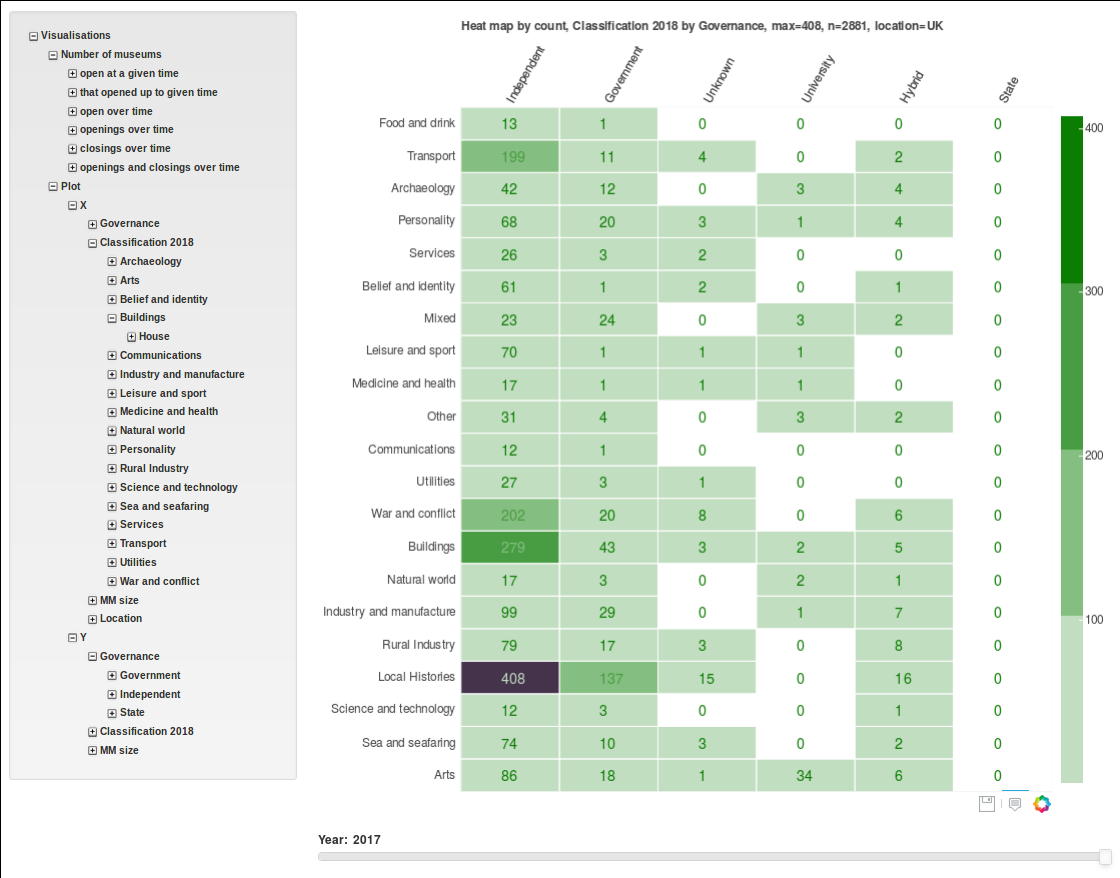
Usage of the database and Web Application by the project’s researchers has already led to insights about periods and regions that show high numbers of museum openings or closings, changes in museums’ accreditation and governance status over the past 60 years, and popular subject areas. There will be two more years of detailed research, both qualitative and quantitative, building on this first phase of research.
The qualitative research is comprising both archival and interview-based work. The quantitative research is investigating correlations between high rates of openings or closings of museums and attributes such as accreditation, governance, location, size, and subject matter. The new attributes Geodemographic Group/Subgroup and Deprivation Index are enabling new analyses into the demographic context of museums’ openings/closing, including cross-correlation of these aspects with the other museum attributes, and hence the charting of new geographies of museums.
Ongoing development work is extending the Web Application into a full Website to showcase the outcomes and findings of the project. We are also developing a new web service to allow the capture of data updates relating to existing museums and the insertion of data about new museums. There will be forms allowing the public upload of such data which will be subsequently validated by the project’s domain experts before being inserted into the database.
The Blue Town Heritage Centre is situated on an atmospheric Victorian high street on the outskirts of Sheerness on the Isle of Sheppey in Kent. Blue Town was a community built for dock workers and a high dock wall looms opposite the Centre. Unusually, the building combines a museum, cinema and a working music hall theatre.
Jenny Hurkett, the founder and manager of the Centre, converted a kitchen showroom she owned with her husband after screening a film on local history that attracted hundreds of visitors. She was motivated by a strong feeling that Sheppey’s history, including the docks and its role in aviation history, was being ignored by regional tourist authorities. Jenny discovered the building was on the site of the Criterion Music Hall (bombed in WW2) and they then rebuilt a theatre which is regularly open for music hall, variety shows, cinema screenings and conferences. Local prisoners were involved in the conversion work. She also established the Eastchurch Aviation Museum and chairs a network of museums in Swale.
The Heritage Centre covers various aspects of local history including the development of the docks at Sheerness; the Blue Town community (named after the blue paint from the dockyard used to protect the wooden houses); a local co-operative movement that predates Rochdale and other aspects of local and domestic history. Upstairs is a purpose-built gallery devoted maritime history full of models, tools, signs, maps and ephemera relating to the docks and the working life of the docker community. It also includes a reconstructed deck scene of the HMS Victory including a captain’s cabin and a gruesome surgeon’s room, complete with sawn-off legs. The centre also provides historic tours of the island and includes a café. It also has a role as community hub and often hosts groups with special needs, alongside their busy theatre and cinema programme.
Photo and text by Robin Newton-Clare and Toby Butler.
The Rifles Museum (also known as the Rifles Collection) is the regimental museum of The Rifles, the largest infantry regiment in the British Army. The Rifles were formed from four existing regiments in 2007 following re-organisation. The museum has an unusually modern focus, including recent campaigns in Iraq and Afghanistan and it is particularly concerned with the lived experience of the soldier in these campaigns.
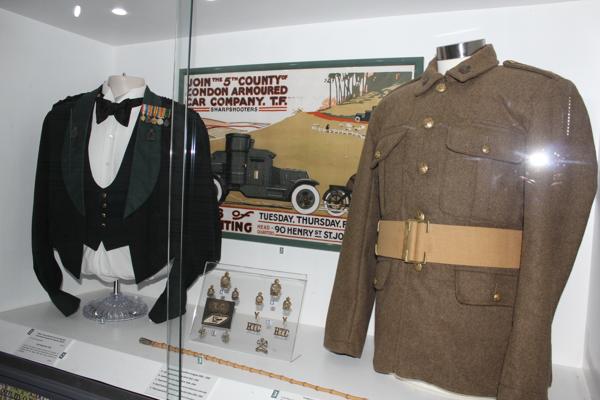
The exhibition begins with the formation of the regiment and focuses predominantly on Iraq and Afghanistan, where the Regiment has been serving. The display consists mainly of information panels and glass cases containing uniform, military equipment, ephemera and souvenirs taken by soldiers. There is a particular focus inter-cultural issues involved in working in these countries. It includes a display of Afghan life and features guides given to soldiers on local customs and useful phrases. The middle of the exhibition space contains a memorial and contemplation area, featuring a cross made of wooden pallets built in Afghanistan to remember members of the regiment who had recently died. The galleries are spacious and large artwork and photography were notable features compared to other regimental museums on the site. A merchandise area has regimental caps, sweatshirts and other clothing for sale. It also had an area for children to dress up in military uniform and sit on a quad bike for photo-opportunities. One display features Iraq ‘tour’ T-shirts featuring Basra Palace, where the Rifles were stationed for some time. The designs parody the famous Carlsberg advert: ‘Basra – probably the worst palace in the world’.
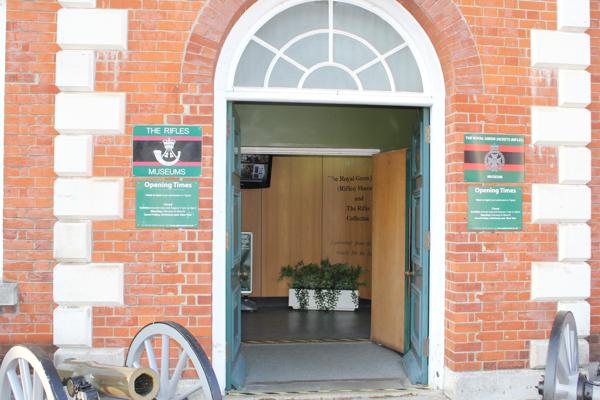
Exhibition at the Rifles Museum
The museum, which opened in 2013, is close to the Rifles regimental headquarters at the Peninsula Barracks in Winchester. The Barracks are extensive buildings built in the early 20th century and are grade II listed, how housing several military museums alongside regimental offices and private flats. The Rifles Museum shares a building with the Royal Green Jackets (Rifles) Museum. The latter was one of the constituent regiments merged in 2007 to form the Rifles and has a much larger exhibition space over two floors including a huge model display of the Battle of Waterloo. The Rifles Museum is separately managed and has a smaller exhibition space on the ground floor. Visitors can enter the Rifles Museum directly (entry is free) but chronologically it focuses entirely on the period after the formation of the regiment in 2007 so visitors are encouraged to see it after the Green Jackets Museum (which focuses entirely on an earlier period, 1741 to 2007). The museum is run by the Rifles Regimental Museum Trust (registered as a charity in 2017).
The museum is dedicated to displaying uniform, medals, weapons, armoured vehicles, models and memorabilia relating to the Kent and Sharpshooters Yeomanry Regiment (the Kent Yeomanry were formed in 1794 and the Sharpshooters were formed in London in 1900. They amalgamated in 1961 and their squadrons are a part of the Territorial Army, currently based at Croydon and Bexleyheath).
The museum is situated in the extensive grounds of Hever Castle in Kent. From the outside it has the appearance of an army field camp, with two hall-sized khaki tents, a flag pole and an armoured car and field gun on display immediately outside; perhaps something of a surprise to visitors to the picturesque castle once owned by the Boleyn family. The tents cover much more permanent structures; one is an education room and the other contains a professionally designed and curated display space.
Inside the displays are chronologically organised, starting with the formation of the Yeomanry for the expected French invasion in 1794 and covering 200 years of regimental history up to the recent present (the squadrons have served in both Iraq and Afghanistan). This includes Gallipoli and the Great War (along with a life-sized recreation of a trench with sound and visual effects), World War II (which includes a hands-on recreation of a tank turret) and more recent conflicts. A registry section includes a list of all members of the regiment who were lost in action and a medal chest containing drawers of military medals donated by families. The museum is generally unstaffed and the displays have been designed accordingly.
The Museum was formed to preserve and display the property of the regiment, at the time of a regimental re-organisation. The museum opened to the public in 1966 at Squerrye’s Court in Westerham where it had a room for public display, given by the owner who was a serving member of the regiment. In 1985 It moved to historic property nearby, Hever Castle, and was similarly housed in a room above the keep. The Castle eventually paid for the construction of the new buildings in the grounds and the museum moved in 2015 after a £275,000 fundraising campaign for the interior fit-out by the Kent and Sharpshooters Yeomanry Museum Trust.
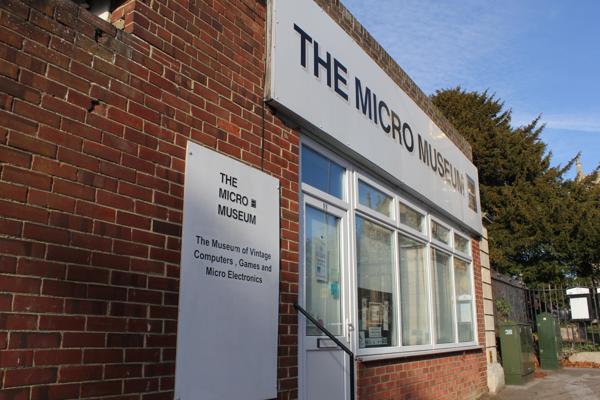
The Micro Museum encompasses vintage computers, video gaming and micro-electronics, such as mobile phones, small electronic games and toys. An array of working micro-computers and games consoles are available for visitors to try out, playing games and programming for as long as they wish. The museum also includes displays on the history of computing.
The museum is located in what used to be a stone mason’s workshop and later a plumber’s merchant, next to a large parish church in central Ramsgate. The reception area has a working BBC micro-computer and libraries of games and magazines on shelves. This leads to a large room which contains both the displays and a large array of different consoles and computers, set up to play at seated workstations. Wall posters cover the history of computing and floor to ceiling units display a huge array of computers and gaming consoles through the ages, mostly divided up by decade and in the case of smaller objects, by type (abacus, calculators, Furbies, mobile phones, LCD games, joysticks and so on). A Sinclair C5 is on display with accompanying information on the career of Clive Sinclair.
Interior of the Micro Museum
Carol and Mike Deer are semi-retired co-owners of the Micro-Museum and it is run as a small family business, with the involvement of a few volunteers. Mike used to work as a gallery attendant at the Museum of London. Carol describes the museum as a showcase for their personal collection of computers, games and electronics (‘basically anything that’s got a micro-chip in it that interests us’ from the 1970s to 2000. Mike started collecting in 1981 when he bought a Sinclair ZX81 in his mid-twenties. This led to buying more powerful home computers and electronic games. As consumer electronics developed so quickly computers and games were soon regarded as obsolescent and could be bought cheaply. The collection was amassed over 40 years and the museum opened permanently to the public in 2014.
The Flower Makers Museum is situated in a high street shop in Hastings old town (the building dates back to the 14th c.). At first sight it appears to be a shop selling artificial flowers, but there is a museum in the basement. The museum opened around 1991 and consists of a large part of the inventory stock of the Shirley Leaf and Petal Company: thousands of cutting tools and flower irons; presses for ‘veining’ fabric leaves; and a large array of samples, products and ephemera concerning the business.
The company manufactured silk flowers and leaves for shop displays, bridal dress decoration, confectionary, Christmas crackers and remembrance poppies. It was established in East London in the 19th century and moved to Hastings in 1910, where hundreds of homeworkers used hand tools to cut, press and make the flowers. The present owner, Brenda Wilson, bought the company in 1981 and moved the machinery and stock from an ex Mission hall to the present location. The business is still going and this is a working collection – the tools, samples and bales of fabric are used, and old presses on display have been converted to electrical power. Presently the company makes fireproof, artificial flowers and foliage for film sets, theatres and fashion designers.
Inside there is a shop counter and a room crowded with artificial flowers and decorative items for sale. Behind the counter there is a back room with a desk, work bench and Edwardian iron press, which is not strictly open to the public. Stairs, crowded with displays and stock, lead down to two rooms, one with a large press behind glass and a huge array of thousands of cutting tools on shelves; the other is loosely organised into sections – one area looks like an old factory office c1910, with ledgers and historic health and safety notices. Another is devoted to clothes and things that were decorated with the flowers. No space is wasted – high and low are bales of silk and other fabric, boxes of supplies and the visitor is free to handle whatever they wish that is in reach. The feeling is part stock room, part workshop, part museum.
Visitors are free to browse unaccompanied. Small capitalised typed labels are helpfully attached sporadically to explain an item or raise a question to make people look a little harder ‘how many species of leaves can you identify?’ Small cardboard mounted displays can be leafed through and contain samples, ephemera and correspondence relating to noteworthy jobs for such things as film or theatre sets. Afterwards Brenda is very approachable and invites visitors to rummage through whatever they like. She clearly enjoys answering questions about the collection. Her display approach to getting as much as possible into a small space was nicely summed up in the interview when she said: ‘I’m very good if you’re packing a car’.
What is a small museum? Or for that matter a medium or large museum? In the museum sector, size is generally measured in relation to visitor numbers, and in cases where several criteria are used, such as income or staff numbers, they are still taken into account. The Mapping Museums research team has followed suit in this respect. We decided to group the museums within our dataset into size categories that are based on visitor numbers. Thus the question for us was: how should we establish the thresholds for these categories? How many visitors equate to small, medium, and large? And should we just use those three categories? What about very tiny or really massive museums?
Arts organisations define size in slightly different ways, and in some cases, single organisations may use a variety of measures. For example, the Association of Independent Museums (AIM) uses the following categories in their ‘toolkit’:
Small = visitor numbers of up to 10,000
Medium = visitor numbers of 10,001 to 50,000
Large = visitor numbers of 50,001+
However, AIM uses slightly different bands when museums are applying for membership. In this case, the smallest category is defined as being up to 20,000, not 10,000, and there is an additional category of ‘largest museums’, which attract over 100,000 visitors. Arts Council England (ACE) data uses the same measures as the AIM toolkit, but only in relation to independent museums. When they assess the size of local authority museums, they use a different yardstick:
Band One: 30,000 visitors
Band Two 30-100,000 visitors
Band Three 100, 000+ visitors
These differences are sensitive to the realities of museum practice. By categorising museums that have less than 20,000 visitors as being small for the purposes of membership, AIM enables more organisations to pay the lower rates of subscription than if it had put the bar at 10,000 visitors. Similarly, ACE recognise that local authority and independent museums operate under different conditions. For the Mapping Museums team, however, the use of different size bands was problematic because it would be difficult to know how to categorise museums that have hybrid forms of governance, for instance, when local authorities retain ownership of museum buildings and collections but outsource its management. Using different size categories according to governance, also meant we would have to change size designations when museums changed status, and it also prevented any direct comparisons across categories of governance.
In the absence of an established rubric for museum size, we needed to decide what size bands to use in the Mapping Museums research. In order to first make that decision we looked to the data and at the overall spread of museums according to visitor numbers.
Figure 1
At this point, we had no visitor numbers for 45% of the museums in our dataset. However, when we plotted the information that was available to us (Figure 1), we could see that there was a clear peak in the data between 10,000 and 32,000 visits per year (with median about 13,000), but that there were no obvious points where the distribution of museums divided into bands. Thus the data did not suggest any clear categories for allocating size.
We then divided the distribution into quartiles, which showed that 50% of museums had between about 4,000 and 40,000 visitors per year (Figure 2).
Figure 2
One option was to create a band that covered the broad group of museums that gain between 4,000 and 40,000 visitors. The problem was that approach would elide the significant differences in scale. A museum that gains 4,000 visitors per year is likely to be run solely by volunteers or by a private individual, with limited opening, and to operate in a relatively ad-hoc fashion. A museum that attracts 40,000 visitors is reasonably well established and likely to have a professional orientation. Thus, grouping these museums did not make sense in an analytic context.
First categorisation
Our next step was to consider how various size categories would support our research. One of the problems of using three bands for sizing is that it lacks nuance. A museum that has 100,000 visitors is clearly very popular and well established but it is not in the same league as one that has visitors in the millions, yet both would normally be classified as ‘large’. Thus we initially decided to introduce more categories (see Table 1).
Size category
Yearly visitor number range
Number of museums (%)
Tiny
0-1,000
4.1
Very small
1,001-5,000
10.8
Small
5,001- 20,000
16.6
Medium
20,001 – 50,000
11.2
Large
50,001 – 100,000
5.6
Very Large
100,001 – 1million
6.1
Huge
1 million +
0.3
Unknown
–
45.3
Table 1
This approach initially seemed to work. However, when we began detailed analysis of the data the researchers found that they were constantly aggregating the three smallest categories. We did not need that degree of nuance for our work. However, we regularly used the category of ‘huge’ as a way of filtering out the very largest of institutions. Thus we decided to revert to a single category for small museums but to keep ‘huge’.
Second (and final) categorisation
Our second set of categories, which we are now using, reads: small, medium, large, and huge. Yet the question remained of where the thresholds would be set for each category. Again we turned to the data, and looked at how the distribution of museums would change if we used 10,000 or 20,000 visitors as the top limit for the category of small, and what difference it would make if 50,000 or 100,000 were used as the upper limit for ‘medium’.
Museum counts
Category thresholds
small
medium
large
huge
0; 20k; 100k; 1m
1318
677
250
13
0; 10k; 100k; 1m
930
1065
250
13
0; 10k; 50k; 1m
930
839
476
13
Table 2
As Table 2 shows, splitting small and medium at 20,000 means that the former category is significantly larger than the later. Splitting the categories at 10,000 produces a more balanced distribution between the two. In both these figures the category of large has relatively few museums because it only includes organisations with over 100,000 visitors. When that threshold is dropped to 50,000, then the size of that category almost doubles.
Importantly, the different size categorisations give a very different impression of the UK museum sector. If small museums predominate then we might assume that the sector is dominated by museums that attract few visitors, are volunteer-run museums or have few paid staff, and that possibly are struggling to survive. In contrast, if there are larger numbers of museums of a medium size, then the sector seems to be more comfortably established, and, if there are high numbers of large museums, then onlookers may conclude that it is flourishing. Thus size categorisations can have a strong impact on perceptions of the sector, even if the actual visitor numbers and lived realities of museum practice remain the same throughout.
After considerable discussion the Mapping Museums team decided to set the size categories as follows (Table 3):
Size category
Yearly visitor number range
Number of museums (%)
Small
0–10,000
22.5
Medium
10,001–50,000
20.3
Large
50,001–1 million
11.5
Huge
1 million+
0.3
Unknown
–
45.3
Table 3
For us, these categories chimed reasonably closely with norms of thinking about museum size, and are similar to those used by the AIM toolkit, which has the advantage of making them familiar within the sector. They lack nuance in the category of ‘large’, but this is not a particular issue for our research, as the focus of Mapping Museums is on smaller museums. Setting the bar at 10,000 also means that small museums do not merge into medium-sized, more established organisations, and we can examine them as a distinct group. For us, this is important because the smallest museums are often sidelined both in research and in professional discussions.
Copyright: Fiona Candlin and Andrea Ballatore, 2018