The Mapping Museums project at Birkbeck, University of London has shown that more than 800 museums have closed in the UK since 1960. There can be many reasons for museums to close: founders retire, land and buildings are lost when leases cannot be renewed and, yes, reductions in income. But lack of funding is often a result of political choices. It is probably not by chance that the rate of closures has accelerated since 2010 – a period that coincides with austerity policies, with all their ramifications.
New museums have continued to open regularly, but 2010 was the first time that closures outstripped openings, and there are now signs that the sector may have begun to shrink. As Higgins says, we need museums. Closures often mean loss of access to collections, and in turn to public history. That too is a crisis that needs attention.
Throughout the pandemic we have been keeping track of museums opening and those closing permanently, or without clear plans for future reopening. We last reported on closures in May 2021, and openings in October 2021. This blog adds to those reports and includes closures and openings that took place between 2020–22. A further ten museums have closed, and we have recorded fifteen new museums opening.
Closures
Of the ten closures since our last report, three were local authority museums. The Museum at the Mill in Newtonabbey closed in 2020, having been open since 2010, and enquiries so far have not yielded any information about the circumstances of its closure. Do let us know if you have any information. In 2021, Baysgarth House in Barton-upon-Humber closed. Open since 1981, the museum was shut pending redevelopment after management was returned to the local authority, so this closure may turn out to be temporary. And earlier this year, Eastleigh Museum in Hampshire closed. Management of the museum was devolved in 2014 to Hampshire Cultural Trust and One Community, a local health and wellbeing charity. The museum was staffed by volunteers from One Community and served as an access point for their outreach services. The charity relocated their services and Hampshire Cultural Trust stated that the museum generated insufficient revenue to make it possible for them to keep it open.
The Museum of Army Music
A further seven independent museums also closed in this period. The Museum of Army Music, formerly in Twickenham, closed in early 2020 and is now in storage in Chatham until a new location can be found. In July 2020, the Hall at Abbey-cwm-Hir in Wales closed due to the financial impact of the Covid-19 pandemic, with no plans to reopen. The date of two other closures is somewhat uncertain, but it seems likely that the Shire Horse Farm and Carriage Museum in Redruth closed in 2020, and the Mechanical Memories Museum in Brighton closed sometime between 2020 and 2021. Two other independent museums have closed in 2022. Flame Gasworks Museum in Carrickfergus shut due to what the management described as operational and financial constraints, and Hull People’s Memorial Museum cited similar but more specific reasons for their closure. These included increasing costs, reduced donations from visitors, and an increased difficulty for volunteers of parking near the museum.
Flame Gasworks Museum
These ten closures bring the current total of closures in 2020–22 to nineteen. Just two of those closures are known to be a direct result of the pandemic.
Openings
All fifteen new museums recorded here are independent, three of them private and the remainder not-for-profit. The latter group includes Grimsay Boat Haven and Grimsay Archive, which opened in 2020. Based on the Isle of North Uist, it preserves the maritime heritage of the Western Isles including five Stewart boats in a large shelter. Also on a nautical theme is the New Coracle Shed in Coalbrookdale, which is dedicated to the history of coracles in the Severn Gorge and opened in 2021. The same year, Redditch in the West Midlands gained its third museum with the opening of Redditch Local History Museum, which has also initiated an archive as part of its work to record the history of the town. The last not-for-profit museum to open in 2021 was the Spanish Gallery in Bishop Auckland. The gallery displays a number of paintings from the Spanish Golden Age and is the latest venture in the larger Auckland Project (the project was featured in the recent Radio 4 series The Museums That Make Us).
Grimsay Boat Haven
A further eight not-for-profit museums opened in 2022. These included Glasgow Royal Infirmary Museum, which illustrates the hospital’s contribution to medicine. Kent Mining Museum is concerned with the history of the Kent coalfield and is built on the site of the former Betteshanger colliery. The UK’s first museum dedicated to the LGBTQ+ community, Queer Britain, opened in London’s Kings Cross in May and was the culmination of four years of events and pop-up exhibitions. A short walk away is Somers Town Museum, which focusses on the history of its local area near Euston station and also serves as a community space. In Scotland, The Battle of Prestonpans Museum and Jacobite Heritage Centre commemorates the eponymous battle that took place in 1745. In the West Midlands, Stourbridge Glass Museum celebrates the town’s glassmaking heritage. The Barn Theatre and Museum near Hastings is home to a collection of toys, puppets, and theatre sets dating from the eighteenth century to the present. And in August 2022, the Yorkshire Natural History Museum opened in Sheffield.
Stourbridge Glass Museum
The three private museums include another on a nautical theme, Margate’s Crab Museum, which opened in 2021. The same year another local history museum opened, in Harwich, Essex. Displays include memorabilia from the popular 1980s TV show Hi-de-Hi!, which was filmed at a holiday camp nearby. On a more literary theme is Mary Shelley’s House of Frankenstein in Bath. The author lived in the city for a time and the museum is dedicated to Shelley and her famous creation.
These fifteen new museums join the fourteen openings in 2020–21 recorded in our previous blog on new museums in the pandemic. As mentioned in that blog, we did not anticipate so many new museums and expected instead to be recording more closures. With nineteen closures recorded altogether so far and twenty-nine openings, the sector has grown slightly during the pandemic. Could this be a sign of resilience, or might we record more closures before the end of 2022?
When we set out to collect data on museums during the pandemic, we were eager to explore how long they remained closed and if they had reopened. The results were not what we expected and finding out why proved a more complicated process than we had anticipated.
To recall, we have built a web-scraping tool to identify words that indicate open/closed on museum websites. Monthly website snapshots allowed us to see how these indicators changed over time and the graph below plots the period between March and November 2021. As you can see, and as we might expect, the references to closure (the blue line) drop and the references to opening increase (the red line).
Thus, the data confirmed our general sense of what happened in this period, namely that museums re-opened after lockdown restrictions eased. However, we were surprised that these indicators stabilized from September onwards. Around half of UK museums websites continued to use language that indicated ‘closed’. Conversations with museum sector staff confirmed that many museums had decided to remain closed in 2021, but we still felt our findings were somewhat high.
We needed to know if the data was correct or if our software was malfunctioning, so we began to check results from individual websites. The result was reassuring in that our web-scraper had correctly identified ‘open’ and ‘closed’ terms. The problem was that the same language was used to describe a wide range of events or instances. For instance, websites announced that they were ‘closed for Christmas’ or that certain part of the museum complex, such as the café or galleries were closed. ‘Open’ was used in a similar way, such as in the case of online exhibitions.
We needed to distinguish between usages of ‘closed’, and so Andrea Ballatore, our resident software expert, designed a new piece of kit. This allowed us to search and analyze specific terms in their linguistic context. We looked at a sample of 1200 museum websites as they stood in September 2021, and in 167 instances the term indicated the site was closed specifically due to the pandemic (‘The museum remains closed due to Covid-19’) and in a further 212 instances, the museum was closed for an unspecified reason although the majority of these are also likely to be due to the pandemic (‘The museum continues to be closed’; ‘We have taken the decision to remain closed during 2021’). There were 42 museums closed for refurbishment and a further 12 references to seasonal closure.
Extrapolating from our sample, we can conservatively estimate that some 550 museums remained completely closed as of September 2021 for reasons connected to the pandemic, although it is likely that the number is likely to be higher. Beyond this, the other usages of closure we found referred to specific parts of a site (e.g. café, galleries), provided general information on opening and closing times, or less often, references to a museum’s history. That information is itself significant because it indicates that in addition to those museums that were entirely closed, many more museums were still experiencing some degree of closure. Large numbers of museums did not resume ordinary service.
In our future blogs we will be examining how those patterns of closure and re-opening varied according to museum governance and size, and presenting current data.
How have museums fared during the pandemic? What can we learn from their websites? And could we rapidly collect crucial information from museum websites to assess the state of the UK sector? These are the questions that have driven our research since the start of the project in January last year. We are delighted that we now have some answers to share.
Over the past few months we have been studying museum websites to find phrases that might indicate whether museums are at risk of closure. We collected these phrases together and created 6 key indicators. These are whether a museum is open currently or closed currently, has applied for or received funding, pursues online engagement, has staff working, or intends to reopen.
Our computer science team developed a tool to scan museum websites for references to these key phrases. We were able to scan websites for 3,300 museums of the 3,345 in our database. The graph below shows how these indicators changed from March to November 2021.
Each line in the graph shows a different indicator, and the higher a line is, the more museums were found with that indicator. The points on each line refer to a date when we collected data from websites.
So what does the data tell us?
The data suggests that a large proportion of UK museums made efforts to engage with audiences online, and their engagement remained relatively consistent across the period for which we have collected data. At this point in the pandemic, it is likely that museums who want to engage audiences in this way have developed the means and resources to do so. This tells us that over 80% of UK museums continued to function in some form in this period.
Another key point is that the indicator for closed currently begins to decline and open currently begins to increase from April 2021. These are generalized trends, but they appear to reflect a gradual reopening of museums. This is earlier than the 17th May reopening date for indoor museums. This early move of indicators is perhaps due to museums modifying their websites to indicate forthcoming reopening and also that museums in Scotland and museums with outdoor attractions were able to reopen earlier, such as English Heritage and National Trust properties. Similarly, the indicator for reopening intent peaks between April and May 2021, as museum websites likely reflected their forthcoming reopening plans.
Following the May reopening, an unexpected trend is that reopening intent doesn’t decrease significantly. This may be explained by the fact that although museums could reopen from 17th May, a number chose to remain closed beyond this point for a range of different reasons.
A final point of interest relates to funding. The graph indicates that less than a third of museum websites made any reference to funding, and this decreases after May 2021. As we noted in a previous blog, the emergency funding situation for museums was complex. A preliminary reading of this data may be that it shows a segment of museums appealing for funding or announcing successful applications. We may speculate that these are most likely independent not for profit museums, given that government museums may have been likely to furlough staff and not as reliant on covering additional outgoings. This will be explored further as we examine the data in greater detail in the forthcoming weeks.
Looking ahead
This graph is a snapshot of what the data can tell us. The six indicators can be analyzed across a range of museum characteristics (e.g. size, governance, location) allowing us to understand variance across the sector. In future blogs, we will present more detailed analyses of this data from museum websites. We continue to collect data, and this will enable us to present longer trends as we incorporate new data into our analysis.
As with any exercise that involves automated data collection from a large number of websites, the data is not perfect as we cannot be fully confident that we have accurately identified every museum website. Also, the six indicators are broad categories that span a very varied use of language on websites. Nonetheless we believe that this analysis shows a broadly representative picture of what is going on in the sector.
We have also designed new software that allows us to drill down into individual websites, which will allow us to fine tune our account, and we have gathered data from museum social media accounts (on Facebook and Twitter). We were able to collect that data over a much longer period, from 2019 until 2021, and that will likely reveal a more nuanced picture of the rush to online engagement at the outset of the pandemic and the first lockdown in March 2020. As 2022 progresses, we will present our findings in further blogs.
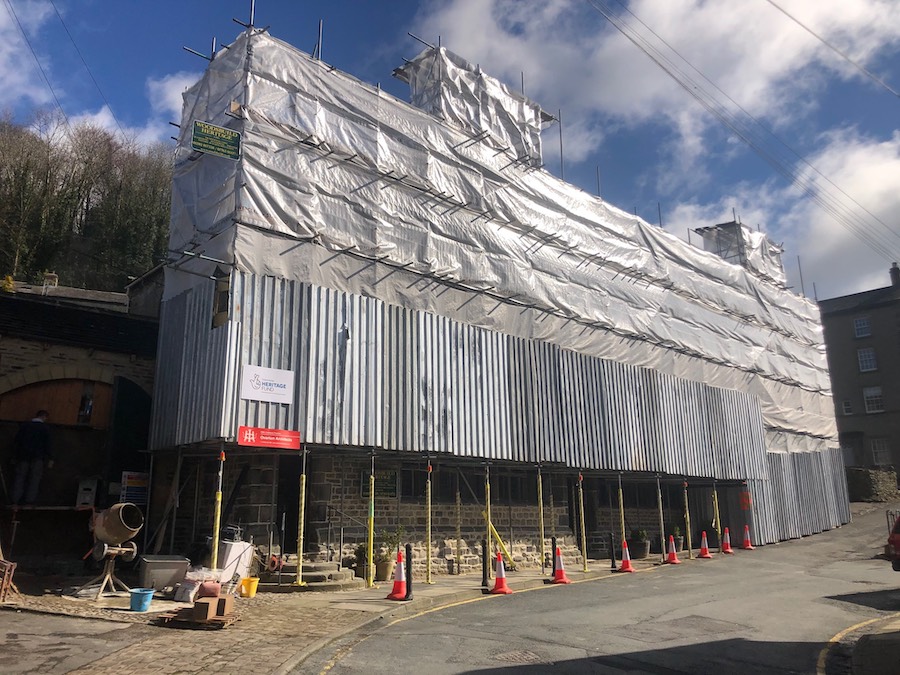
The Museum of North Craven Life covered in scaffolding.
How have small, independent museums coped
during the pandemic? To find out more I talked to the staff at five museums,
all of which are led by volunteers. Their experiences were very varied but it
was striking that none of them had struggled financially, indeed one had
flourished beyond all expectation, and that the main challenges concerned their
volunteers.
Brynmawr and District Museum in the South Wales Valleys is a local history museum with a strong focus on furniture made as part of the Brynmawr Experiment, a Quaker scheme aimed at providing employment in the area during the 1920s and 30s. They took the most lo-fi approach to the pandemic of the museums that we visited in that they simply shut the building and remained closed until June 2021. Like other museums in Wales they were automatically awarded a business rates grant and this covered their gas and electricity bills, which were lower than previous years. Volunteers checked the building on a twice-weekly basis and took advantage of closure to repair some faulty lighting, replace the blinds on the windows, and have the carpet deep cleaned. Otherwise they waited for when they could re-open. The museum has a core group of around ninety supporters who pay an annual subscription and meet for coffee every Thursday morning. Vivienne Williams, one of the original founders and the museum secretary said that everyone had missed the museum. ‘It’s a hub, a social hub’, she explained, ‘they just love the place’. Despite being in her eighties, Viv had no concerns about returning to the museum and said that her fellow volunteers felt likewise: when we spoke, Covid rates were low in the area and the group had all been double vaccinated.
Workers at the Brynmawr Factory 1939, People’s Collection Wales
When I asked Viv if they had developed the museums online activity during the pandemic, she replied ‘No, no, no, nothing like that, we’re all too old for that, Fiona’. Paul Cowan, one of the co-founders and chair of the Pewsey Heritage Centre in Wiltshire made exactly the same remark. Like Brynmawr Museum, they had more or less mothballed throughout the pandemic with two Local Restrictions Support grants from Wiltshire council enabling them to cover costs. These grants went to business-rate payers to help alleviate loss of income during the pandemic.
Pewsey Heritage Centre
When we spoke in May 2021, Paul was worried
about having enough volunteers to re-open on a regular basis. The museum, which
is housed in a Victorian foundry and concentrates on the local history of the
area, usually opens six days a week and they need between 35 and 40 people to
keep running. There are two stewards on duty at any time, while other
volunteers clean the building, or organise and run events that help generate an
income. Most of the volunteers are elderly. Four died during the pandemic
(although not from Covid) and many of the others were uneasy about coming back.
However, five new volunteers from a different demographic had joined the team. One
woman had commuted to London on a daily basis and during the pandemic had
started working from home. She suddenly had four extra hours a day at her
disposal. Another new volunteer worked at a nearby laboratory and had felt it
was time to put something back into the community. In Pewsey restrictions on
movement led to residents having greater available time and on focusing their
attention on their immediate area, and this resulted in younger volunteers
coming forwards. Even so, the museum group still needs more help.
Ingrow Loco
There were no such problems with volunteers returning to Ingrow Loco, a railway museum in Keighley, North Yorkshire. The rolling stock is regularly hired out for use by heritage railways or for special events and so it has to meet modern safety standards and is subject to ongoing testing and maintenance. The museum chairman, Keith Whitmore, explained that ‘a lot of our volunteers are of an age, but nevertheless the engineers were very keen to come back and do some workshop tasks’. The volunteers argued that maintaining the rolling stock was essential work and was therefore permitted under pandemic regulations. The trustees did a risk assessment, took advice from one of their trustees who was also a medic, and then agreed that volunteers could return to work if they socially distanced. Keith said ‘you’ve also got to take wellbeing into account: not just the Covid virus but mental health as well’. For the volunteers, working at the museum was sufficiently important that it overrode their other concerns.
Ingrow Loco
Unlike any of the other museums we visited, Ingrow
Loco re-opened in the summer and autumn of 2020. The museum is on the Keighley
and Worth Valley Heritage Railway and in normal circumstances the steam
locomotives stop outside, dropping off potential visitors. However, during the
pandemic, the railway decided to run a non-stopping service as having groups of
people getting on and off made it difficult to manage social distancing. As a
result, potential museum visitors just went steaming past. To make matters
worse, the railway normally subsidised a vintage bus tour that enabled visitors
to take the train one way and then return by road, stopping off at villages
along the way. This had benefits for Ingrow Loco in that it brought more
visitors to the door. Under financial pressure, the railway withdrew those
funds and the bus service ceased, further reducing the number of museum
visitors.
The furlough scheme and business grants helped Ingrow Loco manage its costs when closed. Once they opened they were eligible for a Local Restrictions Support Grant (open) that mitigated reduced income and they successfully applied for National Lottery Heritage Emergency Funds. These helped subsidise the vintage bus tour and thereby increase footfall to both the museum and the railway. It also enabled them to install contactless payment and to promote the 45596 Bahamas locomotive. Careful marketing generated interest in the south of England and for the first time since the 1960s the Bahamas ran on a number of rail tours that departed from London, generating income to help cover the costs of maintaining the engine. This year the museum re-opened in July and had a busy August, with visitors returning in greater numbers, although they are still below the numbers required to break even.
Metheringham Airfield Visitor Centre
Metheringham Airfield Visitor Centre was unable to re-open, but used the period of closure to their advantage. Samantha Parker differs from the other volunteer staff we talked to by dint of her youth. Having been a trainee at Norfolk Museums Service, she became a volunteer collections manager and trustee at Metheringham Airfield Visitor Centre, and was made vice-chair of trustees this summer. She is also looking for paid employment. She explained that when lockdown started their first concern was for their volunteers. As Sam said ‘we didn’t want them to think they’d been abandoned’ and they duly set up a WhatsApp group and arranged Saturday zoom lunchtimes for when volunteers would usually be on-site. As at Pewsey Heritage Centre, many of the volunteers were vulnerable and were shielding, and others were uneasy about returning. The ensuing lack of stewards meant that the visitor centre was unable to re-open during summer 2020. Others, particularly those involved in maintaining the exhibitions, were keen to come back and in spring 2021, they redecorated the building. The site was originally a World War 2 airbase and the buildings are badly insulated, cold, and expensive to heat, and so are usually kept closed over the winter and for the rest of the year they are open to the public, which makes the timing of any major maintenance work difficult. On this occasion, volunteers could repaint the walls in a socially distanced way and in relative warmth.
Metheringham Airfield Visitor Centre
Metheringham Airfield Visitor Centre was
eligible for business grants that covered their basic outgoing, and they got a
North Kesteven District Council restart grant that allowed them to redevelop
the kitchen and run a café. With the centre’s costs in hand, the trustees started
to meet on a weekly basis to plan in the long term. They had been intending to
apply for Community Interest Status, and being closed to the public gave them
the time to do so. It also prompted them to look more closely at the
organisation and they considered each trustee role in detail, how to diversify
their trustees, volunteer recruitment, governance, and their other activities.
These meetings culminated in a ten-year strategic plan and in recruiting a new
trustee who promptly led on a successful bid for Cultural Recovery Funding.
This enabled them to purchase PPE, to employ a freelancer to improve their
digital presence, and to open an online shop. They re-opened over the summer of
2021. The café has been a hit and they are already planning for next year.
Museum of North Craven Life
Ingrow Loco and Metheringham Airfield Visitor centre both successfully fund raised during the pandemic. The Museum of North Craven Life in Settle, North Yorkshire took that to a different level. The museum occupies a seventeenth-century Grade 1 listed historic house that has variously been a farmhouse, a bakery, warehouse, furniture shop, fish and chip shop, bank, and salvage business. In 2019 Anne Read who had co-founded the museum in 1977 stepped down as its Honorary Curator. The new incumbent Heather Lane, who had previously managed the redevelopment of the Museum of Zoology at the University of Cambridge, took up the post in autumn of that year, intending it to be a project for her semi-retirement. One of Heather’s first moves was to have the building surveyed by Historic England and unfortunately they found that the building was in worse condition than anyone had previously realised. The roof was leaking badly, some of the timbers were rotten, floors were sagging, there was no insulation, and the windows needed replacing. There were also other problems. The museum café was at the opposite end of the building to the kitchen and catering staff had to walk back and forth through the reception area, tea-trays in hand.
The Museum of North Craven Life covered in scaffolding.
They were also short of volunteers. There
were particular conditions at the Museum of North Craven Life that underpinned
this problem. In 2018 a new heritage development officer had introduced a more
professional approach to curating and while this raised standards it also
marginalised some of the volunteers. As Heather explained, the volunteers previously
had total responsibility for exhibitions. Now, feeling that someone else could
do the work they stepped back. The sense that they had to step up or no-one
else would had been a strong motivating force for the group, and that was now
lost. The change in process loosely coincided with Anne stepping down. Recognising
that it was the end of an era several other long-term volunteers decided to do
likewise. Heather wanted to go back to the original model and for the
volunteers to be ‘completely engaged in the research so they feel like there’s
something really worthwhile in coming in and working. There might need to be a
bit of steering, but we’re not there to say this is how you do an exhibition’.
And then the pandemic started. Heather
started applying for funding and was awarded substantial grants from the
National Lottery Heritage Emergency Fund and both rounds of Cultural Recovery
Funding, as well as smaller grants from the East Riding council and the
Victoria and Albert Museum. She also recruited a recently retired chartered
accountant, Richard Greenhalgh as trustee and treasurer. Like Heather he was slightly
taken aback by the magnitude of the task in hand, commenting that ‘I didn’t
expect to be running a small company with hundreds of thousands pounds worth of
grants going through it. I thought it was going to be a “on the back of an
envelope” type of post’.
The accrued funding covered the refurbishment
of the building in line with heritage standards. Window frames and timbers were
replaced, and the building was replastered using traditional techniques that
allow the structure to breathe. The wood ash and horse hair required for lime
mortar and plaster was supplied by local residents who left it in large bins
outside the museum. An old garage immediately next to the café was converted
into a convenient and good-sized kitchen, and the previous kitchen was
transformed into an archive, providing space for a recently acquired collection
of around one thousand glass negatives and numerous prints. The pictures were taken
by the Horners, a local photography firm run by three generations of the same
family between 1860 and 1960 and depict Settle and its residents, often showing
the same people over a number of decades.
The funding also paid for new IT systems and for two heritage development officers to be appointed. Kirsty Mitchell was hired for six months and she overhauled recruitment for the volunteers and trustees, surveyed the volunteers and worked on ways to keep them involved during the pandemic. She set up a Tuesday tea break with mini-lectures on what was happening behind the scenes at the museum. Caitlin Greenwood re-organised the museum shop and commissioned a new website, working closely with the designers to put existing exhibitions online. She also began planning and co-curating new exhibitions with volunteers and a group of local historians. A freelancer was hired to develop online resources for schoolchildren at Key Stages 2 and 3, and a new group of dedicated volunteers are digitising the Horner collection. As Heather said, ‘it’s been really extraordinary to have a pause and to put the museum back on its feet. The museum had to be made sound, we needed to have good infrastructure, to rebuild our relationship with volunteers, and do some business planning. Those were the essentials and with the grant funding we’ve been able to do pretty much all of that’.
The Folly, home to the Museum of North Craven Life, in June 2021
Then, in May 2021, just as the museum was
preparing to re-open to the public, a huge crack appeared in the tower housing
the central staircase. While it is free to go into the downstairs spaces, there
is an admissions charge for the main exhibitions, which are housed upstairs.
The crack meant that the upper floors could not be re-opened, which had serious
implications for their income, as Heather said, ‘We’re looking at a black hole
in our revenue’. Fortunately the café had did extremely well over the summer,
generating just enough income to tide the museum through a few more months, and
Heather is now in the process of applying for further grants, both to have
structural work done on the tower, and to cover the ongoing shortfall in
income.
Benefits and difficulties
During the pandemic, small independent
museums had the advantage of being able to easily close. Their running costs
are generally quite low and the Local Restrictions Support Grant was sufficient
to pay their immediate bills. Ingrow Loco and the Museum of North Craven Life furloughed
their paid cleaning, catering, front of house and project staff, but in both
cases the senior management roles are held by volunteers who were able to carry
on working during lockdown. Thus, the strategic work necessary for re-development
and re-opening could continue without incurring cost, as was also the case at
Metheringham Airfield Visitor Centre.
Ingrow Loco struggled the most because they
re-opened and actively worked to attract an audience, which proved difficult
due to circumstances beyond their control. For both Metheringham Airfield
Visitor Centre and the Museum of North Craven Life, the pandemic gave the staff
time to recalibrate, to rethink their organisation, and to apply for grants.
Although it was personally demanding for many of those involved, on a whole
range of levels, the closure of the museums proved an opportunity rather than a
disaster.
Volunteers and trustees
For me, the most consistent theme to emerge across
the five conversations was that of the volunteers. It was clear that the
museums often played a central role in the lives of the volunteers,
particularly at Brynmawr Museum and Ingrow Loco, and that during lockdown they
had felt the loss of the social interaction and practical activity that it usually
offered. It was also noticeable that participation differed considerably
depending on the volunteers’ roles. At Metheringham Airfield Visitor Centre,
the people who usually stewarded the exhibitions did not generally participate
in the zoom lunchtimes and were reluctant to return to the museum whereas those
who had a curatorial role were ‘champing at the bit’ to return to work. A
similar situation obtained at Pewsey Heritage Centre. They also struggled to
find enough people to supervise the museum during opening hours, but
simultaneously had new volunteers coming forwards to take on the more
complicated tasks of accessioning the collections. It may be that the more
committed and enthusiastic volunteers are those that have the more complex roles.
Alternatively, having a challenge and responsibility may create and reinforce
commitment. All the people we spoke to are themselves examples of highly
committed volunteers undertaking complex and responsible work, particularly Sam
and Heather.
Almost all the museums wanted or needed to
recruit new and younger volunteers. This was particularly urgent in Settle
where a core group of long-standing volunteers had all simultaneously retired. Again
one of the issues here was that they had less responsibility than previously
and were feeling a little disenfranchised. But it was also noticeable that a
combination of strategic recruiting and the effects of the pandemic meant that
museums were able to attract new people and a wider range of people than previously.
And finally, it was clear that the trustees, who are also volunteers, and
especially new trustees with particular specialisms were key to improving the
museums’ capacities and offer during the pandemic.
When museums first closed to visitors in March 2020 as a result of the national lockdown, their prospects seemed poor. Andrew Lovett, Chair of the Association of Independent Museums thought that the impact of the pandemic made it inevitable some museums would ‘just run out of cash and go to the wall’, with collections potentially being lost. Likewise, the director of Arts Council England was concerned that major arts organisations would be put in real jeopardy by the crisis and that some might not survive, and other commentators similarly forecasted mass closures. In fact, only nine museums in the UK have permanently closed over the past year, significantly less than in previous years (there were 26 permanent closures in 2017 and 16 in 2018), and only one of those closures can be linked to the COVID crisis. In this blog we briefly review the reasons why they closed their doors.
Pembrokeshire Candle Centre
In two cases the museum closed when the owner retired. In September 2020, Inger John, who had run the Pembrokeshire Candle Makers Centre in Wales, announced that she had used up her remaining wax, was stopping production, and that she would be closing the associated museum. The museum exhibits were offered for sale. A military museum at Fort Paull, a Napoleonic fortress in Yorkshire, announced that it was closing in early 2020. At the age of eighty, the owner and director had decided to sell the site and retire. He was keen to find a buyer who would preserve the attraction, and a group of enthusiasts formed a company with a view to bidding for the property, but they were unable to raise sufficient funds. The contents of the museum were sold at auction in early 2021.
Fort Paull
Four museums closed due to the loss of their premises, although why this happened varies. The Commando Museum opened in 1993 at the Spean Bridge Hotel near Fort William. The property later changed hands and with redevelopment pending, the volunteers started looking for alternative accommodation. When that proved unsuccessful, they put the exhibits into storage until such time that a new venue could be found. Staff at the Maritime Museum in Walton-on-the-Naze in Essex found themselves in a similar situation. The museum was housed in a historic lifeboat house owned by Tendring council who in 2015 announced a rent hike, to be introduced in steps. The volunteers were keen to relocate since the building was cold, damp and situated at the end of a cul-de-sac, so footfall was low, but two attempts at relocation fell through, and the museum had to close. The collections are in storage.
The Commando Museum
Walton-on-the-Naze Maritime Museum
The Metropolitan Police Service Museum Heritage Centre also found itself out of a home, in this case, when the building changed use. Run by the police, and part of that service, the building was moved to secure level operational status, making it off limits to the general public, and the Heritage Centre was duly closed. It is being relocated to a new space in Woolwich, which will open later this year, but it does not have a dedicated exhibition area. Although the Heritage Centre will continue to function as an archive and repository, and although it has objects on loan to other museums, it is no longer a museum in its own right. And the Bruntingthorpe Aircraft Museum in Leicestershire closed in the summer of 2020 when the site was sold. According to an enthusiasts’ forum the land was owned by the Walton family and while David Walton had supported the museum over many years, other family members had opted to sell the land for redevelopment as a massive carpark. The owners of the aircraft were given until the October of that year to vacate the site.
Bruntinghthorpe Aircraft Museum
Ashworth Barracks
Elsewhere,
finances were an issue. The Victoria Cross Trust opened the Ashworth Barracks
Museum in Doncaster in 2014 to house their collection of military artefacts. In
2020 they announced its closure, commenting that running a museum had never
been among its core objectives, rather they had been established to maintain
war graves. No reasons for the closure were given but the lease on the premises
was due to expire in June 2020 and the trust had been struggling to generate
enough income to cover the museum’s overheads. Parts of their collection were
loaned to Sheffield with other exhibits going into storage.
All the museums we have mentioned
so far were small, unaccredited, and with the exception of the Metropolitan
Police Heritage Centre, run by private owners or voluntary groups. The Falconer
Museum in Forres on the North East coast of Scotland was an accredited local
authority museum, and indeed the only museum in the Moray area that was funded
by the local council, two others having been closed in the previous six years.
Faced with budget cuts of around £10m, in 2019, the council decided to close
the museum service with estimated savings of around £87,000 per year. The
museum was established in 1871 and exhibited artefacts belonging to the
Victorian geologist and botanist Hugh Falconer and his brother Alexander, as
well as social history, archaeology and world heritage collections of national
and international significance. Attempts to find a third party to run the
museum were unsuccessful, not least because the building is in need of repair,
and the museum remains mothballed.
The Falconer Museum
The closure of these museums was a subject of regret for the volunteers who had run them, and the groups and local residents who campaigned for their survival. The exception is the Jack the Ripper Museum in London, where news of its imminent closure was met with some delight. The museum was controversial because its founder originally applied for and was granted planning permission for a Museum that focused on women’s history, whereas it actually concentrated on the murder of five East End women. In September the feminist historian Dr Louse Raw discovered that the company had declared insolvency. In their blog ‘F Yeah History’, Natasha Tidd and Helen Antrobus pointed out that the museum suffered from a lack of local trust, that it had responded to controversy by closing down communication, which would have an impact on its public profile, and that with poorly executed exhibits there was little enticement for visitors to return, factors that may have had an impact on its closure. Given that it was a commercial venue reliant on ticket sales, and (so far as we know) did not receive any emergency funding, it is also likely that its insolvency was linked to the pandemic and the consequent lack of income. The building failed to sell at auction in May 2021.
It is likely
that the impact of COVID may have been the final nail in the coffin of the Jack
the Ripper Museum. Otherwise, what is striking about these closures is that
they have little relation to the pandemic and instead are due to other more
usual factors such as retirement, the loss of a site, the difficulty of finding
new accommodation or changed accommodation, lack of income, and government cuts
to local authority budgets, often in combination. As we will discuss in our
next blog the availability of emergency funding has made it possible for most
museums to survive the past year, although often with considerable human cost
since there have been significant cuts to the workforce. The question is
whether and how the situation will change over the next year or more. The
research team will be monitoring the UK museum sector until 2022 and so do subscribe
to our blogs if you would like to receive regular updates.
We would like to thank the Museums Development Network; Museums Galleries Scotland; and Museums and Archives Division, Wales for their help in compiling this information. All our data can be consulted on the Mapping Museums website. Please get in touch if you know of any other museums in the UK that have permanently closed over the past year.
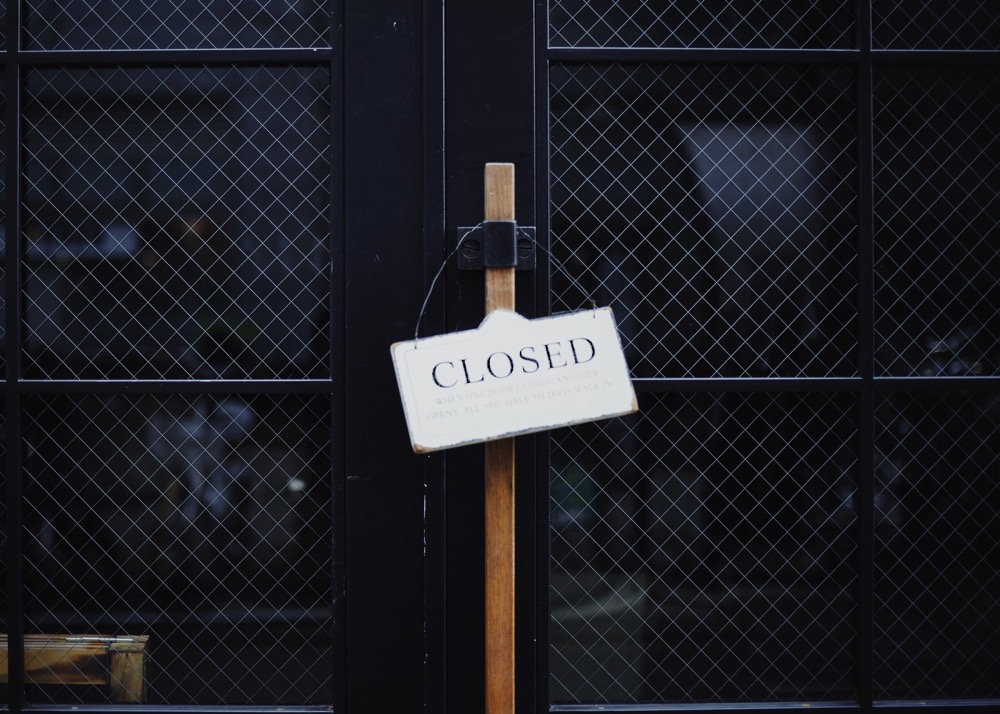
The rapid spread of coronavirus has forced museums in the UK to close. Although those closures are temporary, some museums face financial difficulties as a result, and have raised the prospect that they might close permanently. But not all museums close in the same way. My own research into museum closure in the UK over the last sixty years shows that there are different types of museum closure, and some have more impact: they are more final than others. In this blog I outline two types of closure.
Hard closures have the greatest impact. They could be defined as one in which the museum has closed for good, with no plan for reinstatement, and the collections have been disposed of. An example of this kind of closure is the Christchurch Tricycle Museum in Dorset, a small private museum which closed in 1995, apparently due to financial problems, and whose collection was sold at auction a year later.
The sale of collections at the end of a museum’s life is perhaps the hardest form of closure, but there is arguably less impact in the case of closures where collections are transferred to other museums. The Barnes Museum of Cinematography in St Ives, Cornwall closed in 1986, but parts of the collection are still available to the public in two other museums: Hove Museum, run by the local authority, and the Italian National Museum of Cinema in Turin. This partial transfer of collections to other museums can be seen as less severe than a sale of the whole collection, but dispersal to museums in two different countries makes access more difficult, and it is not clear what happened to the remainder of the objects in the Barnes collection.
Private museums such as Christchurch and the Barnes are not subject to the same ethical and legal constraints on disposal as accredited museums and those run by local authorities or trusts. When such museums close, they are obliged to dispose of their collections in a way that maintains public access. When the local authority museum in Burton on Trent, Staffordshire closed in 1981 the collections were dispersed, although attempts were made to keep the items as local to Burton as possible. Plans were made for most of the objects and archives to be sent to six different institutions, many of them in or close to Burton, and local schools. One of the receivers was the privately-owned Bass Museum in Burton, predominantly a museum of brewing, which charged for admission (often a factor in reducing access). Another was Shugborough Hall, a historic house leased by Staffordshire County Council from the National Trust, which was twenty miles away from Burton. Although the dispersals were relatively local, they would still have made it more difficult to view the collections, formerly gathered together in one place.
By contrast, soft closures have much less impact. They include
the replacement of one museum by another, which can happen when museums amalgamate
or expand. The Timothy Hackworth Museum, for instance, a railway museum in
Shildon, County Durham, was absorbed into a new larger museum, Locomotion, that has the same site and
subject matter. So although the original museum closed, all of its collections
remain available and it could be said to have closed in name only. Something
similar could be said of the Museum of Liverpool Life, which was so popular
that it could not accommodate all those who wished to visit. It was closed in
2006 to allow building works to begin for its replacement, the much larger
Museum of Liverpool, which opened five years later. In these cases the
closures were planned, and intended to be temporary.
The closure of museum branches, although these are relatively rare,
can be also be considered as having a softer impact. The Theatre Museum in
London was a branch of the V&A in Covent Garden, a few miles from the main
museum in South Kensington. When the Theatre Museum closed in 2007 the
collections were reintegrated into the V&A. The Museum of Mankind,
which was a branch of the British Museum until it closed in 1997, is a
comparable example. The collections remain available at the British Museum,
although by one account the return was not without
problems, including an initial lack of display space and fundamental
differences in curatorial approach, which emerged in the process of
redisplaying the African ethnographic collections. Although these museums have
closed, they were branches of larger museums that remain open in the same
cities and retain the collections that were on show. Far less has been lost
than when a museum closes and sells its collections or disperses them widely.
From these examples, it is possible to identify
some dimensions of museum closure. One is time: closures may be final or they may
be part of a longer-term plan for replacement with larger facilities, as in the
cases of the Museum of Liverpool Life or the Timothy Hackworth museum. The
dimension of time also applies to the dispersal of collections, which can
happen in stages as they pass through different institutions. Most of the
collection at the Hunday museum of farming in Northumberland was sold first of
all to the museum at Stapehill Abbey in
Dorset. What began as a dispersal to a single site then became more dispersed
when, seven years later, the Abbey’s collection was sold at private auction.
The way in which the Hunday museum’s
collections were gradually dispersed draws attention to another dimension of
closure: the destinations of the closed museum’s collections. They may be
dispersed quite locally, as with Burton Museum, or much more widely, as were
the Barnes Museum collections. This is not only a question of geographical
distribution, but also of the type of destination. At one extreme, the
collections of a museum could end up in the hands of many different private
owners, which may prevent future public access. One example is the sale of Walter Potter’s Museum of Curiosities, a
collection of whimsical taxidermy formerly in Bramber, Sussex, which was sold
in 1984 and moved to Jamaica Inn, Cornwall, before being sold at auction in
2003 and dispersed. But objects from a closed museum may also remain entirely
within other museums – in the simplest cases just one museum, as when the Museum
of Mankind was closed.
For the majority of the public, the main impact of harder closures is to reduce access to museums for those used to being able to visit them. As the Museums Association stated in their 2017 report ‘Museums Facing Closure’: “Closing a museum denies the public access to their heritage and significantly undermines the human right to culture”. Although the impact can vary from one museum closure to another, it usually reduces access to collections. When collections are sold and dispersed to private collectors, access may be denied to the public completely. But not all museums close in this way, and softer closures usually result in collections remaining available, albeit sometimes widely dispersed.
The rapid spread of COVID-19 has led to virtually
all UK museums being closed. The issue at hand is whether these temporary closures
may become permanent, and which museums are likely to be the most resilient,
both in the short and long term.
Of all the museums that have existed since
1960 (when our data collection begins), 18% have closed. However, rate of
closure varies by museum governance. 34% of privately-owned museums and 21% of
local authority museums have closed, whereas closure rates among national and
not for profit museums are comparatively low at 9.5% and 8.5% respectively.
Small museums are also much more likely to close than medium, large or huge
museums.
These closures took place under very
different circumstances to those we face today. Never before has the entire UK
museum sector shutdown in this way, challenging the basic operating model of
attracting visitors to physical sites. Here we consider what light our data might
shed on the current situation.
Independent museums: private
Private museums tend to be owned and
operated by individuals or volunteer groups, or are run as a business or are
attached to one: they can span a museum in a living room, a privately-owned historic
house, or a museum of a large company. In each instance they usually operate
outside of the frameworks of professional museum support. Historically, closure
rates are high. This can be because the owner has retired and sold assets,
because there has been little succession planning, or because the business runs
into financial difficulty, resulting in the sale of a site or collection. COVID-19
is a (relatively) short-term threat that presents an acute danger to museum
owners’ health and their finances. But the threat posed will likely be
different for private museums based on their size and scope.
Private museums that open on an ad-hoc
basis by individuals or volunteer groups might be well placed to weather a shutdown.
While they may have bills to cover, without significant outlays (particularly
paid staff) they may have flexibility to suspend operations in a way that other
museums might not. By contrast, private museums that are visitor attractions in
their own right, or whose future is contingent on the success of a business,
are threatened by the global economic recession which appears likely to
accompany the pandemic. A significant downturn in tourism and domestic spending
may significantly reduce the means of owners and their ability to open and
maintain their museums.
Independent museums: not for profit
Not for profit museums comprise the biggest
group of museums in the UK. They are constituted as charitable trusts and this
formal infrastructure and eligibility for a diverse range of funding contributes
to their longevity. Not for profit museums also span a range of venues, from
small village museums to some of the largest museums in the country. Again,
museums at the margins might be more resilient to the current circumstances.
Some smaller museums, often with a focus on local history and operated by volunteer
groups, might be more adaptive to enforced closure. Equally, small museums with
diverse funding sources (such a project grants) may be somewhat shielded from
declining visitor income.
However, museums that depend heavily on visitor revenue (including admissions and events) face uncertain times, particularly as many not for profit museums do not have significant reserves. For example, the Mary Rose Museum in Portsmouth generates 90% of its revenue from visitors and a prolonged shutdown could see it lose its entire annual income. In the long term this crisis might see a significant reduction in not for profit museums’ operational capacity – the tourist economy will likely take years to fully recover; there may be a decline in donations (given the effect on private finances); and grant-giving bodies are pivoting resources to an emergency footing. The Arts Council is reallocating £160m funding – expending nearly all its reserves – to support cultural organizations and cultural workers during the crisis. This support is likely to last for a significant time following the end of the crisis, and revenue for capital and programme development may be significantly curtailed as a result.
Local Authority museums
Local authority museums are owned and
operated by, or on behalf of, local authorities and are largely tied to their
economic health. These museums have a closure rate of 21%, and this tends to
occur when the authority takes drastic measures to cut expenditure, resulting
in the rationalization of museum services. 59 local authority museums closed
between 2009 and 2017, following the global financial crisis. Accompanying budgets
cuts saw museum roles hollowing out and expertise lost, further undermining
institutional resilience. With core operational funding, the threat to local
authority museums is not so much in the immediate term but the years ahead as the
UK likely faces a more severe recession than 2008. While the government
stimulus package (announced 11 March 2020) provides a £500m ‘hardship’ fund for
local authorities, the long-term effects of the crisis will likely place a
heavy financial burden on local government resources, which will increase the
likelihood of further local authority museum closures or asset transfers.
National museums
National museums receive core
funding from central government. They have a closure rate of 9.5%, although
this is inflated as it includes branch museum closures (e.g. the British Theatre
Museum, a branch of the V&A, closed in 2007). Historically,
the resilience of national museums is because government grant-in-aid supplied
the majority of their operating costs. However, over the past 30 years national
museums have been geared towards privatization, significantly increasing self-generated
revenue as a proportion of their annual income. This now presents serious implications
for national museums. For example, 61% the V&A’s annual income is
self-generated and 39% grant-in-aid. The museum’s director, Tristram Hunt, has estimated
the museum will lose £1,000,000 per month during closure, while the Museum’s
annual report notes its reserves can cover operational costs for between 3 to 6
months. While it is unlikely that national museums will see permanent closures,
it is likely that the government will have to bolster their funds and this may
be at the cost of jobs, rationalization of core functions, or have implications
for capital expansion and exhibition programmes.
Conclusions
The outlook for the museum sector is
uncertain because the trajectory of the virus and its impacts are unclear. In
China, South Korea and Japan, museums that were instructed to close in January
have now begun to reopen to the public, albeit with restrictions. However,
these countries mobilized quickly to track the disease and lock down cities in
a way that seems unrealizable in the West. The UK government indicates that a
shutdown of normal life could last from 3 to 12 months.
The government response and its support for
the museum sector has been opaque. It is anticipated that some museums might
benefit from small business loans and Business Relief Rates, while calls have
been made to utilize the £120m ringfenced for the 2021 post-Brexit ‘Festival of
Britain’. However, it is unclear how emergency funds would be deployed and
which parts of the sector would most benefit from them. Beyond a blanket
bailout, detailed work needs to be done to understand vulnerable museum
communities that should be eligible for support.
The magnitude of this crisis will undoubtedly cause museums to close permanently. Already some museums, such as Creswell Crags, have launched their own fundraising appeals to help secure their finances. In the short term, it appears that the most vulnerable will be established independent museums (private and non-profit) that are significantly dependent on visitor revenue and business revenues. By contrast, the repercussions of a massive economic bailout, will likely lead to difficult decisions for local authority support for museums in the coming years.
The Mapping Museums research team will
continue to update the database to track museum closure and establish how the
museum sector changes as a result of this crisis. The database can be used to
find local museums (and prospectively offer support) and can be edited – please
inform us if you know of museums that close permanently. Documenting the sector
will create valuable data to support decisions taken by government and sector
bodies in the challenging times ahead.
The museums sector generally concentrates on current practice and developments; it does not keep longitudinal data that would enable academics and museum professionals to trace patterns over time.
The result is that commentary on closure is focussed on the very recent past and lacks a broader perspective that could add insight to contemporary analyses of this phenomenon. As part of the Mapping Museums project we have built a dataset charting the development of UK museums since 1960, and we have used this to draw the first substantive picture of museum closures over time.
At the outset there are two important points to address relating to museum closure that we’ve encountered while building the dataset.
The first concerns data collection. Given the historical focus of the project, a great difficulty has been finding information regarding precise years of closure. Recent closures and closure of well-established museums are fairly well documented. The real difficulty has been tracking down information for smaller, grassroots, regional museums – particularly those that closed 15, 20, or 25 years ago.
We have conducted extensive searches via websites, historical guidebooks, and museum directories. When these were exhausted we sent emails or made telephone calls to individuals or groups, including regional museums services, local history societies or town clerks. We sent hundreds of communications in this way. Sometimes our contacts provided definitive information on when a museum closed; sometimes they could not.
For opening and closure years we have been able to generate accurate information for about 90% of museums. This has been an unprecedented undertaking and has drawn together information from a disparate range of sources. For the remaining 10% we’ve employed year ranges or made informed estimates, which we have mitigated with appropriate statistical methods in our analysis¹.
The second point is that, almost counter-intuitively, closure is difficult to define.
For example, if a museum ceases regular public opening hours but remains accessible in some form, should we continue to consider it open? This happened at Leith Hall House in 2009, which is now open for guided tours only. As the property is still accessible and continues to be advertised by its owner, the National Trust for Scotland, we consider it open, but this is, of course, debatable.
Furthermore, is closure is connected to premises? When a museum merges into another site, should we consider it closed or just having changed location? For example, in 2015 the Clockmakers Museum moved from its own premises into the Science Museum. Should we mark the museum closed and the collection a constituent part of the Science Museum? Its website indicates that the Clockmakers Museum retains a distinct identity. As such, we have kept it open.
The most difficult conceptual aspect to closure is that some museums don’t close per se, they gradually cease to exist. This is often the case with farm museums, where exhibitions of rural bygones are supplanted by other visitor offers (e.g. farm shop, petting zoo) so that the museum display doesn’t close with a thud at a specific moment, but gradually slips away without a whimper. In such instances we have contacted owners and discussed how best to record such forms of closure.
Generally, we have looked at closure on a case by case basis and tried to balance continuity versus change. If an effort has been made to keep a museum alive in some form we have tended to respect that, although we would log instances of material change, such as if a local authority museum was taken over by a volunteer group, etc.
Analysis
Turning to the analysis, it should be noted that these are preliminary results that will be refined prior to more formal publication, so some of the numbers presented here may be subject to slight change.
In total, we have recorded nearly 4,000 museums as being open to the public in the UK between 1960 and 2017, of which around 3,250 are currently open. This is a significant increase on the Museum Association’s estimate of 2500. Our larger number is partly due to the fact that we have a more encompassing definition of what a museum is and count unaccredited museums that may not be included in other surveys.
The figure of 3,250 open museums means that since 1960 there have been about 750 closures. This is around 20% of the total.
First let’s begin by considering the rate of closure over time.
Figure 1: Plot showing rate of museum closure in the UK by year, 1960-2017
This is a simple smoothed line plot showing the number of UK museum closures per year since 1960. There are two types of plot used in this analysis: smoothed line plot (which shows average figures and is best for perceiving general trends) and spiky line plot (which shows precise figures for specific years).
As you can see in Figure 1, peaks in closure begin around the mid 1980s (with an average 13 closures per year) with another in the late 1990s (with an average 20 closures). Following the economic crisis in 2008, the closure rate accelerates, peaking in the last few years with closures averaging 30 per year.
Figure 2: Plot showing rate of museum closure in the UK per year, 1960-2017
Figure 2 shows closure information for specific years; the highest annual number of closures we recorded was 39 museums in 2015.
A particularly significant finding from this data is that it demonstrates that around 200 museums have closed since 2010. This provided an interesting contrast to the Museum Association’s figure of ‘at least 64′ closures over the same period, cited in their Museums in the UK 2017 report.
It is clear from these graphs that closures are rising more steeply in the current period than at any point since 1960.
However, if we look at these figures in the wider context of museum opening we get a different perspective.
Figure 3: Plot showing museum openings and closings in the UK, 1960-2017
This smoothed line plot shows the annual number of UK museum openings (in green) and closures (in red) since 1960. It demonstrates that while closure rates are increasing, they are doing so in the context of a sector that until very recently has been consistently expanding.
This data substantiates the rapid expansion of museums during the 1970s and 1980s, which is often termed the ‘heritage boom’. Since the early 1990s the rate of openings has declined but they have still outpaced closures in every year except four.
Figure 4: Plot showing museum openings and closings in the UK, 1960-2017
This spiky line plot shows more clearly that for every year between 1960 and 2014 (with an exception in 2010), more museums opened than closed, meaning the sector expanded. The result is that the sector peaked in terms of total number of museums in 2014.
However, in 2015, 2016, and 2017 this trend was reversed by marginal net losses. What is particularly striking is that 2017 saw the lowest number of museum openings in the UK since 1960. This figure is 16 museums per year.
Generally speaking, this would appear to indicate a picture of robust growth over the longer term. From approximately 900 museums in 1960, the sector has seen a 260% net gain to the current situation in which numbers have begun to plateau.
However, drilling down into the data reveals some divergent trends.
For example, while the sector has grown substantially in this period, its composition has markedly changed.
Figure 5 shows number of closures by decade based on museum governance. (Note: Here we are using a simplified governance measure: ‘independent’ includes private museums or those run by trusts or foundations, while ‘state’ comprises national and local authority museums).
If we consider closure by governance, we can see that greater numbers of independent museums are closing than state run museums.
Figure 5: Museum closure by governance per decade in the UK, 1960s-2010s.
This may be expected, particularly given that smaller, private museums are often financially shaky ventures. For example, between 2010 and 2017, our data shows that over 150 independent museums closed compared to roughly 60 state run museums.
However, a more significant observation is that in proportionate terms, the closure of state run museums is higher than that of independents.
Figure 6: Plot showing percentage proportion of museum closure by governance in the UK, 1960-2017
This plot shows museum closure as a proportion of governance type.
As we can see, proportionate closure of state run museums begins to outpace closure of independents around 1995. Since 2000, the average proportionate rate of closure of state run museums has been 1.1% per year compared to around 0.7% for independents.
If we examine the data further we can see significant spikes in 2011 (when 1.8% of state run museums closed), 2015 (with 1.5%) and 2016 (with 2.4%).
When we factor in openings over this period, we also see that fewer state run museums have opened than closed since 2000. The result of this is that the state run museums sector has seen a net decline of around 14% in this period
Around 5% of this decline is accounted for by museums lost to closure while 9% is museums transferred by local authorities into trust status (which we have termed ‘hybrid’ status). We are still calibrating this aspect of our data and this figure could be higher.
In contrast, since 2000, the independent museums sector has seen a net growth of 9%.
We can see how these trends have changed the composition of the sector over the longer term.
Figure 7: Cumulative open museum by governance in the UK, 1960-2017
According to our data, in 1960 there were around 900 museums, of which 40% were state run and 50% were independent. In 2017, of the 3,250 museums we recorded, roughly 22% are state run whereas 70% are independent. As a result, we can see that the State’s direct contribution regarding the provision or management of museums is shrinking while the sector is becoming dominated numerically by independents.
Conclusions
These are some of the preliminary findings from our research.
They indicate that from 1960 onwards the museum sector expanded continually until 2010, with a slight decline in that year, but then saw further growth until it peaked in 2014. This represents 54 years of museum growth.
However, around 200 museums have closed since 2010 and for the last 3 years closures have outpaced openings. Significantly, 2017 saw the lowest rate of museum opening since 1960.
It is important, however, not to conflate the overall growth of the sector with what is happening within it. It is clear that museum growth has been principally driven by the independents and that they now ensure that the overall number of museums in the sector remains relatively static.
It is also clear that the decline in the number of state run museums – through closure or change in status – has been considerable.
This raises significant questions about the type of skills, facilities, and experiences, that are being lost with the contraction of State run museums. This issue is not just one of closure but the loss of public sector institutions.
Hopefully these initial findings provide insight into the development of the sector over the longer term and help inform the conversation about the impact of the current age of austerity on the museums sector writ large.
We will be releasing further results as we continue our analysis, so please subscribe for updates or follow us on twitter: @museumsmapping
¹ The results on which this analysis is based have been weighted to account for the uncertainty in the data. When more accurate data is not available, we use a date range for the opening and closing years of museums. For example, if we know a museum was opened between 1965 and 1975 but are unable to specify a particular year, the range of possible years (in this case 10) will be divided equally and the probability (0.1 in this case) will be added to the results for the years in the date range. This avoids over-representing individual museums, and provides a more realistic quantification than a simple count.