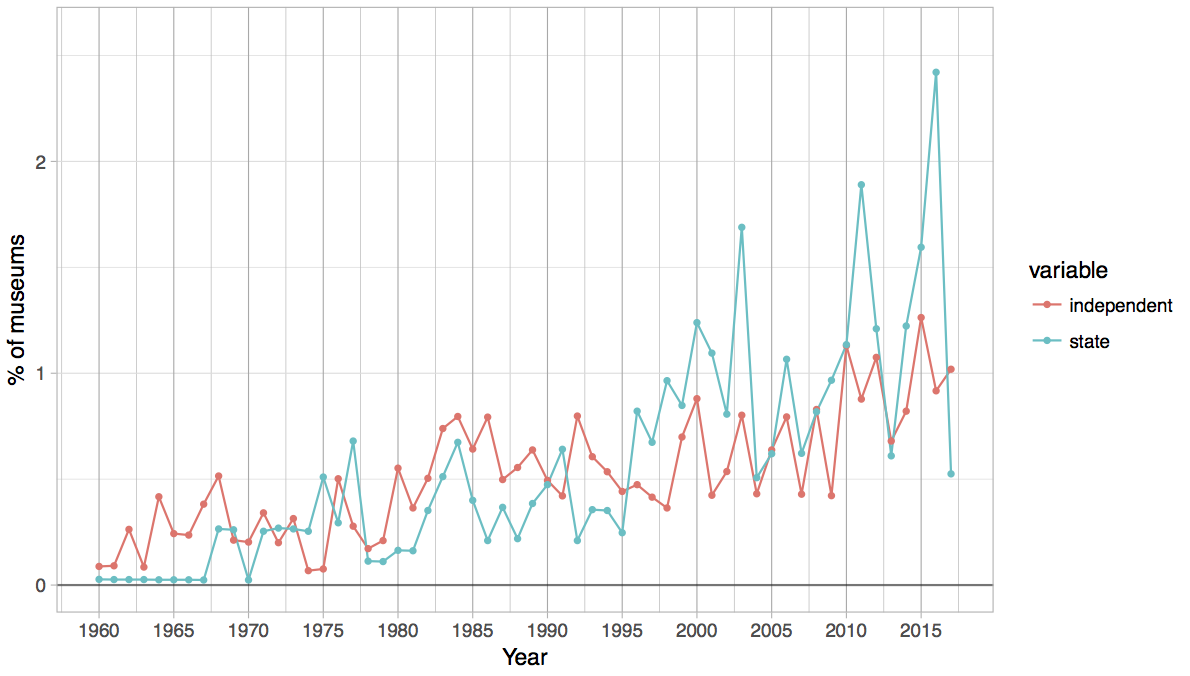
Figure 6: Plot showing percentage proportion of museum closure by governance in the UK, 1960-2017
Figure 6: Plot showing percentage proportion of museum closure by governance in the UK, 1960-2017
Figure 6: Plot showing percentage proportion of museum closure by governance in the UK, 1960-2017