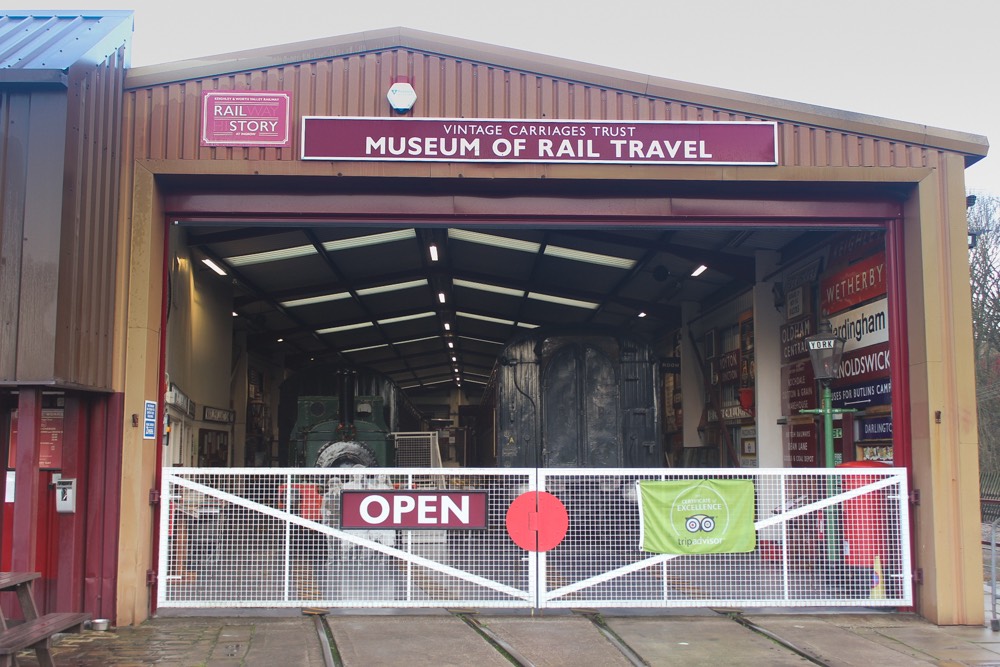
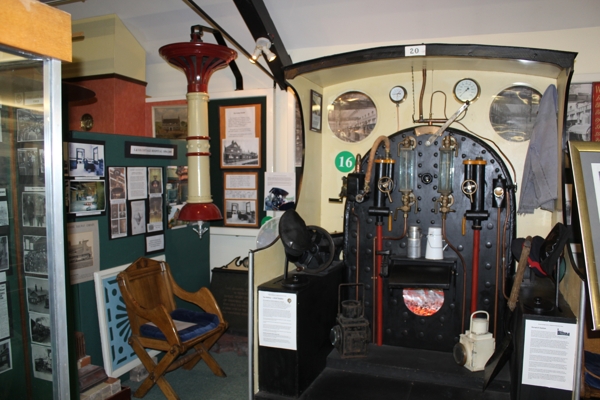
The Museum of Rail Travel is devoted to railway carriages through the ages. It is run by the Vintage Carriages Trust, formed in 1965 by a group of volunteers interested in the preservation of wooden-bodied carriages, and now has nine historic railway carriages, three small steam locomotives, a railbus and a large collection of railway signs, posters and magazines. Visitors can enter the carriages and numerous films have been shot using the carriages as a film set, including the Railway Children.
The Museum is on the outskirts of Keighley in West Yorkshire, adjacent to Ingrow West railway station and Ingrow Loco Museum. The station is part of Keighley and Worth Valley Railway (KWVR), a five-mile long heritage railway that runs to Oxenhope reopened by the KWVR Preservation Society in 1968, the first privatisation of any part of British Railways. The Museum of Rail Travel is in a purpose-built carriage works/museum with sets of rails connecting it to the adjacent railway. The building is divided into two main sections – a museum space containing a series of historic carriages, signs and displays and a large workshop area devoted to carriage repair and restoration. The building also contains a well-stocked shop selling new and second-hand railway enthusiast books and a substantial collection of railway magazines and journals (13,000), which are for sale and are an important income stream for the Trust.
Visitors can sit in many of the carriage compartments and stickers on windows of the carriages detail films the carriage has featured in, listing the title, year made, stars and location of the carriage for filming. Somewhat surprisingly many of the mannequins featured in displays are, on close examination, incognito members of the royal family. A young queen is off to Brighton and Princess Margaret sits on a station bench in a scarf and enormous sunglasses.
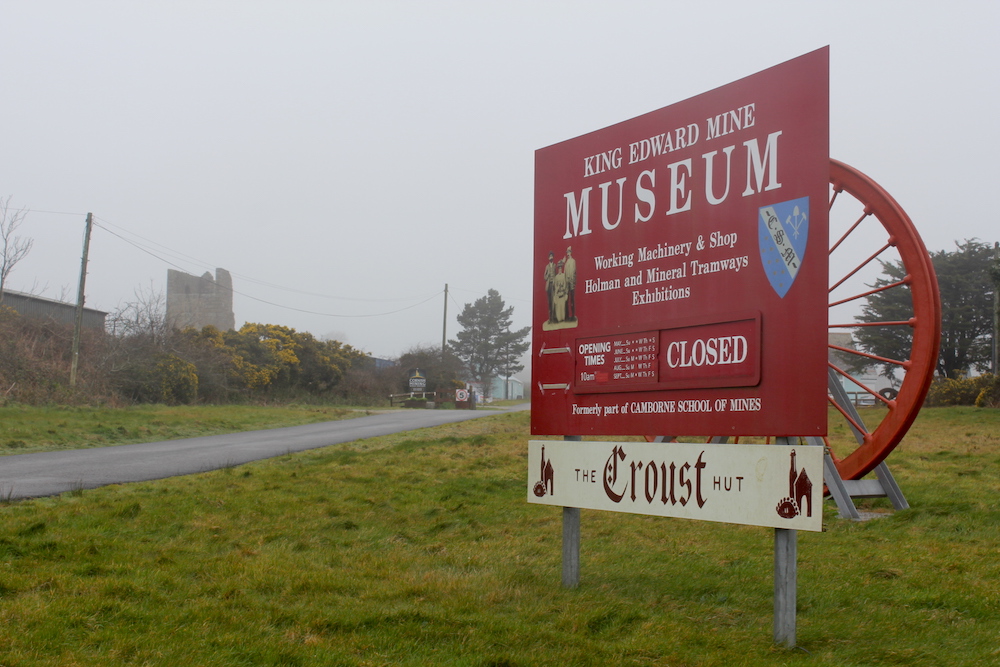
King Edward Mine Museum interprets the history of Cornish mining on the site of a tin mine used by the Camborne School of Mines for training from 1897. The School moved to Poole in the 1970s leaving many of the buildings redundant. The King Edward Mine Preservation Group was set up in 1987 to preserve the buildings and collect, restore and display industrial machinery used by the Cornish mining industry by a group of volunteers (initially mostly staff from the Camborne School of Mines). The project has received major European and Lottery funding and is now part of a UNESCO World Heritage Site (2006).
A private road leads to the mine complex, which is remarkably complete and includes an array of workshops and historic industrial buildings, several of which are now listed, and a popular café. Several buildings on the site have been converted for small business use. It includes an Edwardian lecture room, complete with rock samples and books, although this is not currently part of the public exhibition.
The museum first opened in 2005 and now has displays over several buildings. A stone-built Boiler House (1906) contains contextual displays on the people and land surrounding the mine, and covers social history, archaeology, geology and the history of tin mining, mostly with the use of illustrated display boards addressing questions about mining (e.g. “was it dangerous or unhealthy for children to work at the mines?”) with some related objects, mostly in cases and video/audio displays (one speaker is memorably installed in a Cornish pasty which can be lifted to the ear). The winder and compressor house contain displays on winding machinery and drilling, along with explanations of the various processes carried out to extract tin at the mine in the Edwardian period. The displays range from large machinery with detailed and illustrated explanation on information panels, to objects and models in cases, often making use of extensive archive photographs of the site and the machinery. A large corrugated iron clad mill building contains an array of working machinery, much of which has been restored to working condition and visitors can see it in action, including enormous stamping machines used to crush rock.
The founder of the museum Tony Brooks has published an illustrated history of the mine, including a section on the early preservation work King Edward Mine: An Illustrated Account of Underground and Surface Operations 1897-2001 (Cornish Hillside Publications, 2002).
One of
the aims of the Mapping Museums research is to examine trends in subject
matter. We wanted to know if the rates of opening and closure varied according
the subject of the museum, whether each country or region favoured museums
devoted to different subjects, and if there were differences as to when
particular subjects emerged as being popular choices for new museums. Above
all, we wanted to understand whether subject matter could be understood as a
social barometer: were trends in subject matter indicative of wider or popular
concerns? To accomplish this work, we needed to classify all the museums in our
database according to their over-arching subject matter, so we looked to see
what systems were available.
The Problem with DOMUS
The
most recent taxonomy for museum subject matter was developed for the DOMUS survey,
which was conducted between 1994 and 1999. The classification system remains in
use, most notably by the Museum Association’s Find-A-Museum service (although
it is now used to classify collections rather than museums in their entirety
and the categories of ‘Mixed’ and ‘Arms and armour’ have been dropped).
The DOMUS system divided museums into twenty-two categories:
Agriculture
Archaeology
Archives
Arms and Armour
Biology/Natural history
Costume /Textiles
Decorative / Applied arts
Ethnography
Fine art
Geology
Maritime
Medicine
Military
Mixed
Music
Numismatics
Oral history
Personalia
Photography
Science / Industry
Social history
While
DOMUS provided a longer list of categories than previous museum surveys, it was
not sufficiently detailed for our research purposes. For instance, we suspected
that the majority of railway museums opened in the late 1960s and early 1970s,
shortly after steam locomotives were phased out and following the second Beeching
Report of 1965, which resulted in over half of all stations and some 33% of
track being closed. These closed lines provided space for enthusiasts to run
their engines, and the redundant stations functioned as exhibition space. This
history is not shared with buses, or cars, or helicopters, which would also be
classed as Transport. If we wanted to tease out the various histories of
Transport then we needed to be able to distinguish between them.
Similarly,
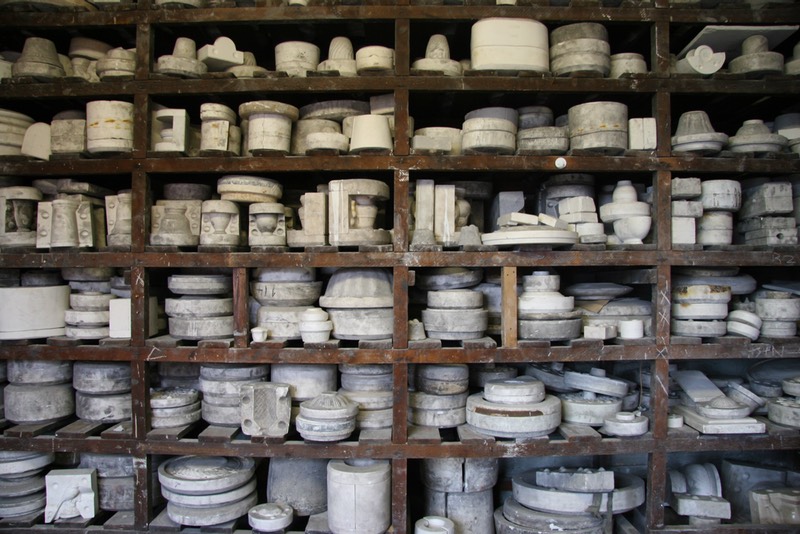
we wanted to examine the patterns of emergence of manufacturing museums. Did
museums devoted to pottery open at the same time as those of mining? Was there
a correlation between the demise of certain industries and the foundation of
museums on those subjects? Did all industries have their museums? Clearly,
then, we could not have a single capacious category of Science and industry, as
was the case in the DOMUS system; we needed a taxonomy that allowed for a greater
degree of discrimination.
One
way of managing the lack of detail within the DOMUS system was to introduce
sub-categories. However, we had several other reservations about its usability.
One issue was that some of the categories blur subject matter with methodology.
Social history and oral history are ways of pursuing history, while an archive
refers to a specific type of collection, and they are not subjects in
themselves. It is entirely possible to have a social history of aristocratic
women’s lives in the eighteenth century or a social history of Welsh mining in
the late twentieth century; an oral history of performance art or of hop
picking in Essex; and an archive of political ephemera or matchbox labels. This
elision had practical consequences for the efficacy of the classification
system. In DOMUS, social history was used as a synonym for open-air or living
history museums, or as a means of describing museums that used dioramas or
other media to present a contextual display. As a result, museums were divided
across subject matter categories depending on the form of their exhibition: museums
of rural life were misleadingly split across Agriculture and Social history,
and museums of industry were similarly split across Science and Industry and
Social History.
There
were also noticeable gaps in the DOMUS system, which stayed close to conventional
academic disciplines, and to the categories common to nineteenth and early
twentieth century museums. While there were three different categories for
visual arts: Decorative / Applied art; Fine art; and Photography there
was no category for local history or for museums devoted to particular
buildings. (Although some historic buildings act as little more than containers
to museums, and their subject matter is quite distinct from their
accommodation, on other occasions, the building is the artefact and the point
of the museum). Likewise, there was no category for museums devoted to
different denominations and faiths, to the fire, police, prison, and rescue
services, or for museums that address popular or everyday subjects such as fairgrounds
or radios.
And
finally, the categorisation system reinforced normative conventions. For
example, Military focuses attention on the armed forces, state sponsored
conflict, and recent conflict, and it marginalises historic and unsanctioned
modes of struggle and the everyday experience of war.
Given all
these problems, we decided to develop a new classificatory system for the
Mapping Museums project.
The Mapping Museums taxonomy
Devising
a list of categories is a practical and logistical task. It needs to cover a
wide variety of museums but not be so long a list as to be unworkable, and
terms cannot include each other or overlap to any great extent. We began devising
our system by deleting, rejigging, and adding to the existing DOMUS categories
to create headline categories. This process went through numerous iterations,
and at each stage we tested our taxonomy against our list of museums. After six
months of editing, only the categories of Archaeology and Transport remained.
In
creating our new taxonomy, we dropped Social history, Oral history and Archives
as categories for the reasons discussed above. There were no museums solely
devoted to coins so we cut Numismatics, and
after much discussion, we removed Ethnography since this focuses on objects’
country of origin, rather than on their subject matter as such. For example,
clothing from the Solomon Islands would be categorised under ‘Ethnography’
rather than with clothing or fabric arts from elsewhere in the world.
We
replaced Personalia, which emphases collections of objects, with Personality,
which is centred on the individual in question. Science and industry have been
decoupled and we have linked Industry and manufacture, which encompasses both
the processes and the products of manufacture. Costume and textiles,
Decorative/applied arts, Fine art, Music, and Photography were collected
together as ‘Arts’.
We
renamed and implicitly re-shaped some categories to make them more inclusive. ‘Agriculture’
has been replaced with ‘Rural industry’. Late twentieth century surveys have
used the two categories relatively interchangeably and we have chosen the
wider, more encompassing term. We added health to Medicine, so as to encompass other
varieties of healing and wellbeing more generally; Geology and Biology/Natural
History were subsumed under the wider title of Natural World; and Maritime
became ‘Sea and Seafaring’, so that it would cover subjects such as fishing as
well as sea-borne trade and naval matters. We followed the Museums Association
in taking Arms and armour to be part of Military, although we have renamed it
War and conflict, a term is intended to include wider aspects of conflict.
We
also introduced the new categories of Buildings; Belief and identity; Communications;
Food and drink; Leisure and sport; Local history; Services; and Utilities.
Other was added for museums that do not easily fit anywhere. This work produced
the following list:
Archaeology
Arts
Belief and Identity
Buildings
Communications
Food and drink
Industry and Manufacture
Leisure and Sport
Local history
Medicine and Health
Mixed
Natural World
Personality
Rural industry
Science and technology
Sea and seafaring
Services
Transport
Utilities
War and Conflict
Other
We continued the process with respect to sub-categories. For example, Transport is divided as follows:
Aviation
Bicycles
Bus and Trams
Canals
Cars and motorbikes
Mixed
Trains and railways
Other
Where possible, we introduced sub-categories when a single group was large and unwieldy. Large categories such as Transport have several sub-categories, while the relatively small category Food and drink has none. Again, the sub-categories went through numerous iterations, not least when we took our data to be checked by external experts (see the previous blog: Picking the Brains of the Museum Development Network).
Having worked out a usable system, we had to classify all 4,000 museums
according to subject matter. This was no small endeavour, but we are now able
to analyse historic trends and geographical patterns in subject matter in close
detail. That research has produced some surprising results, which will be discussed
in future blogs.
Can you help us to evaluate the Mapping Museums website?
Mapping Museums is a large-scale research project that is based at Birkbeck, University of London, which aims at documenting at analysing the development of the museum sector from 1960 until 2020. We have now designed a database that enables users to browse, search, and visualise information on 4,000 museums and have developed a website that contains information on our initial findings, definitions, our research process, and the interview based research (including images and transcripts).
The evaluation session is an important means for us to gain
feedback about the usefulness of the website. With your input we can further
improve the system before it is made publicly available.
We’d like a wide variety of people to participate in the
evaluation trial especially those who work in the museum sector or in academia.
The trial session will be based on three activities:
A hands-on introduction to the web application.
Using the application to undertake a small number of information searches. This will allow us to gauge how easy the system is to use.
Group discussion about your experience of using the system and the ways that it could be improved and extended.
The session will take no more than two and a half hours.
Information obtained from you through the session will be used
to inform the research work of the project and subsequent research
publications. All personal data collected from this study including your name
and contact details will be kept confidential. No reference will be made in
oral or written form that could link any participant to information they have
provided to us as part of this the study.
Your participation in this study is voluntary, and you may
withdraw from the study at any time.
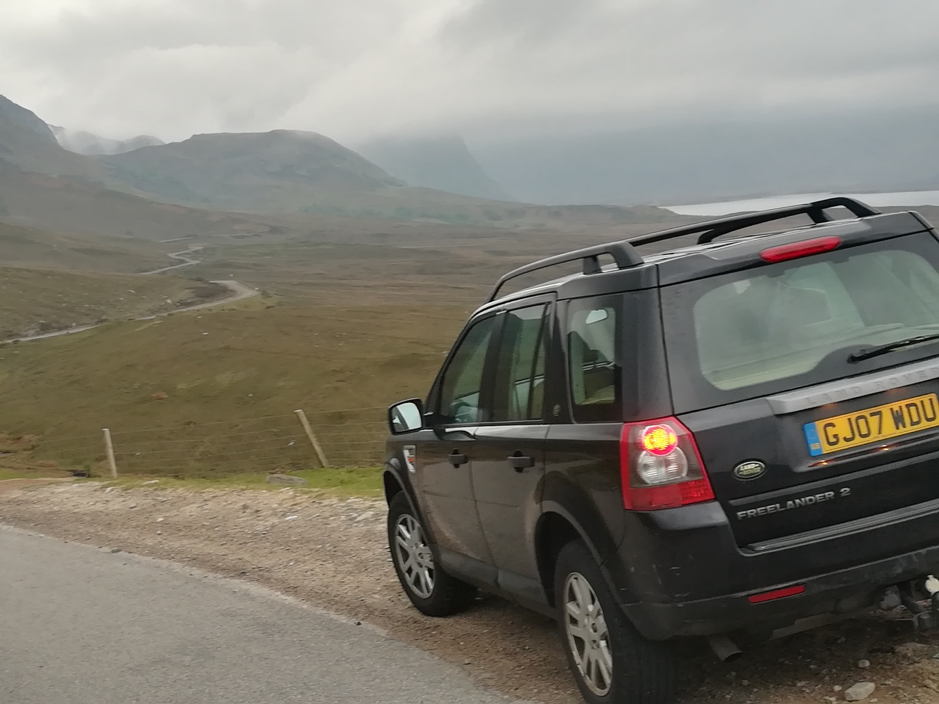
(Header photo: Toby’s car parked on the single track road on the way to Gairloch)
I have driven the length and breadth of Britain for Mapping
Museums to complete one of the most rewarding tasks on the project –
interviewing people who have set up independent museums. I have now recorded
more than 60 museum founders and in the process I have driven 5,870 miles to
meet them and it’s time to reflect on the trials and tribulations of life on
the road as an academic field researcher.
First there is the driving. We felt it was important to get
as wider geographical demographic spread as possible, and as many museums were
in remote locations the car was the only practical option. I visited and
photographed 40 museums, which in itself was a joy, but along the way I also got
to see some stunning parts of Britain that were new to me – redundant mills in Lancashire;
the snow swept Yorkshire Dales in December; the ruins of World War II airfields
in Lincolnshire. I kicked myself for not exploring these areas before, all just
a few hours’ drive away from my own home in Kent.
The luxury of a car also meant I could take as much equipment and luggage as I liked. For each trip I would carefully go through my packing list: laptop and digital recording equipment for interviews, notepad and paperwork, SLR camera for photographing museums inside and out, battery chargers, folding bicycle (for exercise and to give me a break from the car), a thermos flask for in-transit tea, wellies and two coats along with the usual clothes and toiletries. I also had room for a couple of bulky luxuries to make life on the road easier; firstly a four gang extension lead, with various chargers attached, perfect for charging all my equipment in rooms with few plug sockets. And finally my own feather pillow, which pretty much guaranteed me a good night’s sleep.
Between interviews life on the road was solitary, apart from
the odd hitchhiker and a few days when my path crossed with Jake, my project colleague
who was researching some of the underlying causes of museum development in
Cornwall. In the car the radio and downloaded BBC Sounds programmes were my
main companion – along with the scenery. This was most spectacular in the
Highlands of Scotland, which I criss-crossed to make meetings with founders of
croft and clan museums. Many of the small museums in the Highlands (such as Laidhay
Croft Museum and Gairloch Heritage Museum) hug the coast road, often single
track, with passing places to allow other vehicles to get by. and astonishing
views of lochs, mountains, cliffs and ancient peat bogs. The bright gorse
flowers were made even brighter by sunshine in an unseasonal heatwave (‘Auch,
it’s always like this in Scotland’, I was told several times).
Fair weather driving in the HighlandsTemporary road closure: crofters at work on Skye
Much of this work fell over the winter months, when many
smaller museums have shut their doors and the people who run them have more
time to talk. The week before Christmas I experienced the childish excitement
of a snow flurry in Pateley Bridge, a picturesque little town in the Yorkshire
Moors. I was there to interview Eileen Burgess, the 89-year old retired school
teacher and co-founder of Nidderdale Museum (a huge local history museum in
what was once the town workhouse). I stayed above a pub and after work went for
a snowy walk in the upper dale. That evening I joined the town’s Christmas fair
wandering from shop to shop to be offered mulled wine and Christmas nibbles –
so warmly welcomed that for an evening I felt like an honorary Yorkshireman.
The hardest weather was at Land’s End. I needed to get to
the Isles of Scilly and there had been a long period of gale force winds and
even supply boats hadn’t got through to the islands for a week. A morning
flight from a Cornish airfield was my only option. I stayed at the Land’s End Hotel
the night before; the hotel is on the cliffs next to the famous landmark.
Before I went to bed I ventured out and could see huge waves crashing on the
shore below. The wind howled all night. The next day I discovered that a crew
of French fisherman had been rescued from a fishing boat caught up on the rocks
below.
The next morning the wind was still gusty, but the direction was favourable for flying and I was relieved to get a call from the airport to say the flight was possible. But they warned that the unpredictable forecast meant they couldn’t guarantee the return journey and I would have to risk getting stranded on the Isles of Scilly. I had a tight interview schedule and I had driven so far; I decided to risk it.
The view from the plane, Cornish coast
After a frankly terrifying flight on the sort of small plane
that has a passenger sat next to the pilot, I had a few hours to interview Richard
Larne, author, wreck diver and founder of the Charlestown Shipwreck Centre. After
a fascinating interview in a café in St Mary’s, I got an urgent call from the
airport recommending I get the next flight before the weather turned. Richard
kindly agreed to rush me to the airport in his car for an even bumpier flight
back to the mainland (as it turned out, this was indeed the last flight for some
days). When we landed with a thump I gave a cheer, along with the five other
passengers. Now all was well and we were both very relieved; Richard had
narrowly escaped an uninvited house guest for who knows how long, and I could
make my next interview on time. And so the extraordinary journey continued –
next up would be Tony Brooks, ex-head of mining at Camborne School of Mines and
the founder of the King Edward Mine Museum. I’ll discuss the wonderful array of
project interviewees in my next post.
By Toby Butler (Research Fellow, Mapping Museums Project)
The Nidderdale Museum is located in the market town of
Pateley Bridge in an area of Outstanding Natural Beauty in Nidderdale, one of
the larger Yorkshire Dales. It was established in 1975 by members of a WEA
adult education local history class who had published a landmark local history
book, A History of Nidderdale in
1967. The museum has an extensive collection concerned with life in the
Nidderdale valley and includes a variety of interiors featuring objects donated
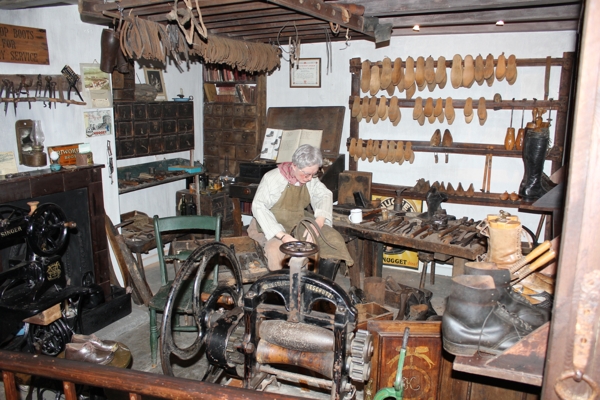
or rescued from local buildings including a kitchen, pub ‘snug’, school,
Victorian parlour, dairy, shoe makers, magistrates court and even a
walk-through reconstruction of a mineral mine shaft. It won the National
Heritage Museum of the Year Award in 1990 for the ‘museum which does the most
with the least’.
The museum is run by the Nidderdale Museum Society and housed
in an old workhouse, built in 1863. This became the Rural District Council
offices until local government reorganisation in 1974, when the district council
was amalgamated into Harrogate Borough Council and the building became
available (the latter owns and maintains the building). The museum has 11
themed exhibition rooms situated on one upper floor, a large research/library
room and store rooms, workshops and meeting rooms on the ground floor. Apart
from entire rescued interiors like the town court room, striking objects
include a wooden haberdashery box marked ‘BLIND’ belonging to a local blind
hawker in the 1920s; an astonishing early electric hair curler from a
hairdressers featuring more than a dozen wired curlers dangling from the
ceiling and a large collection of Methodist related ceramics and other items
from local chapels. Highlights of the collection and an account of the history
of the museum feature in a book, Traces
of Nidderdale in 40 Years and 40 Objects: Stories of the Museum by Joanna
Moody (2014).
Horwich Heritage Centre is a local history centre in Horwich, a town of 20,000 people near Bolton in Lancashire, on the edge of the West Pennine Moors. The town expanded rapidly in the 18th and 19th century as bleach works, cotton mills and a large railway locomotive works came to the town. The museum first opened in 1995 and is now housed in what was a rifle range, part of an early 20th Century territorial army barracks. The displays cover a range of industrial and social history of the town and the surrounding area. Exhibits include an iron toll gate post, a replica of an engine cab, a scale model of the locomotive works, a huge gas lamp from a cottage hospital and a large collection of models, household items, photographs and ephemera organised thematically on various local history including a Victorian kitchen, domestic life 1900 to 1950s, mining, and transport and wartime history. The museum has regularly updated temporary exhibition space, a research area for local study and a small shop.
Entrance to Horwich Heritage Centre
The Centre is run by Horwich Heritage, a voluntary organisation established in 1985 following the closure of the locomotive works two years before (the works once employed thousands of people). The aim was to set up a history society that would, in part, help to boost the morale of the town and it soon attracted more than 150 members. A small room was offered by the local council to have exhibitions in a community centre that was used for displays for ten years from 1995 to 2005. The Council then offered them tenancy of the current building and it took three months to set up the displays. A range of activities and new exhibitions bring in around 3,000 people a year (the centre is open two hours a day). Horwich Heritage has also been working to save some of the historic buildings in the works, and are developing a heritage trail around the site, and working with the developers on street naming. It has also been actively restoring and protecting local features and details of this work can be found in the news section of their website.
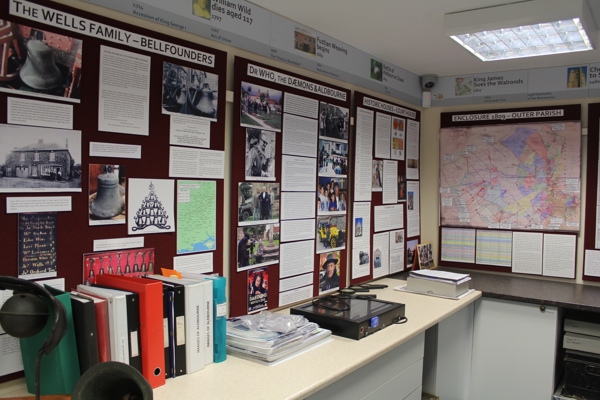
Aldbourne Heritage Centre is concerned with the history and heritage of Aldbourne Village in Wiltshire. It was established by Aldbourne Heritage Group in 2014 and the displays include the Aldbourne Cup, a pottery vessel dating from 1500BC; a collection of bells made in a local bell foundry and various aspects of farming, local industry and the social history of the village. It has a display on the ‘Band of Brothers’ commemorating the history of the nearby Second World War US paratrooper base made famous by an HBO TV series. The Centre also has an extensive archive of 10,000 photographs and hosts regular history talks at the nearby Methodist Church.
Entrance to Aldbourne Heritage Centre
Unusually, the Heritage Centre is situated in converted public toilets, near the centre of the village. The building is stone, brick and tile and was converted to an internet café by a youth group before it became a heritage centre. It is a small, one-room museum with a modern, well-lit and carpeted interior and public toilets are still situated at one end of the building. It is immediately adjacent to a pub with a Dalek outside. A well-known series of episodes of Dr Who (The Daemons) was filmed in the village in 1971 starring John Pertwee in which the Doctor visits ‘Devils End’ to investigate a satanic vicar and discover the secret of mysterious burial mound. A timeline featuring major episodes in village history runs around the top of the room and current displays covered the bell foundry (including bell ringing and a substantial collection of bells); Dr Who and the Daemons; historic houses; enclosure; notable residents of Aldbourne; the inhabitants of Aldbourne in 1809; the Aldbourne Cup, Aldbourne WI and US Airborne in Aldbourne 1943-4. The Centre also has a substantial website including digital records of Rolls of Honour, grave inscriptions and field maps.
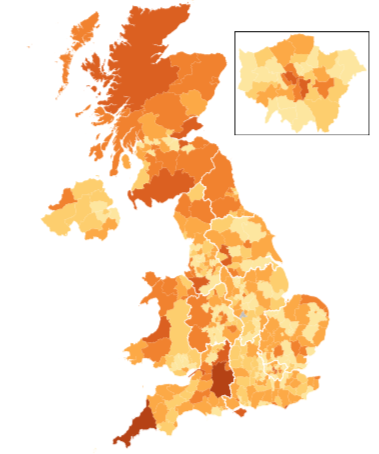
Map of museums growth UK 1960-2017 by Andrea Ballatore
Until fairly recently, I had no idea that organising museums according to their location could be quite so complicated. In the original proposal for the Mapping Museums project, we had stated that we would develop a database that would enable researchers to search our data according to a museum’s location and to visualise that information. For instance, a user could browse through all the museums in Yorkshire or see them marked as points on a map. That seemed reasonably simple. Why, then, did this task keep me awake at night?
I now know that there were three key questions and areas of research, but initially, they blurred into one confusing mass. We needed to decide which boundaries we would use, how the database would be organised with respect to location, and to identify the datasets that would underpin the database and create map-based visualisations. We also had to think about the needs of different users. This blog looks back on why we initially struggled with location and the decisions we made about how to map our data.
Choosing boundaries
The first task was deciding which boundaries we should use to search and map the museums listed in our dataset. The Museum Development Network and Arts Council use regions as the basis for organising support and funding. The Office of National Statistics also uses them in statistical analysis, and so my first thought was to follow that structure. I quickly found information on the nine regions of England and then looked for data on Northern Ireland, Scotland, and Wales, only to discover that for analytical purposes, those three countries are considered to be equivalent to regions. Putting Scotland or Wales on a par with the East of England or the West Midlands seemed to imply that these countries had the same status as a sub-section of England, and hence were insignificant in relation to England as a whole, which was problematic.
Our next approach was to organise our data according to counties. I then discovered that there are various different types of county: historic counties have their origins in the Middle Ages and still form the basis of many contemporary boundaries; ceremonial counties, which are also referred to as the geographic counties, and which are overseen by a Lord Lieutenant; and the administrative counties, which were replaced by metropolitan and shire counties. Given that we are likely to consider the allocation of financial and other resources, it seemed sensible to use the boundaries that relate to Local Authority administration, and so the Mapping Museums Computer Science researcher started to build the map according to metropolitan and shire counties. Unfortunately, when he presented his work, the image had large gaps with no information. It took me some time to work out that, even though counties are commonly referred to in each country, for administrative purposes, Wales is divided into unitary authorities, Scotland’s sub-divisions are known as council districts, and Northern Ireland has local government districts. Thus, these areas did not show up on a map that referenced counties.
The situation becomes even more complicated within England, which is divided into metropolitan and shire counties, and unitary authorities. Greater London is its own entity and does not belong to any of the other groups. Each of those categories then further sub-divides. Whereas the administrative units in Northern Ireland, Scotland, and Wales have only a single tier, England has a more complex hierarchy. Metropolitan counties divide into metropolitan districts, shire counties divide into non-metropolitan districts, and Greater London into London Boroughs. Unitary Authorities do not have sub-divisions at this level. Table 1 makes this organisation clear.
Table 1: Administrative organisation of the UK
The local authority units are differently constituted in the four countries. However, to make the situation more complicated there are different kinds of administrative geographies. Depending on the public service (census, health, postal, electoral, etc.), the territory of the UK is sliced up in different ways, as displayed in Figure 1.
Figure 1: Hierarchical representation of UK statistical geographies
For the purpose of analysis, some geographical entities like counties are widely used by British people to cognise the territory of the UK, but do not cover the entire space, leaving areas with museums unreferenced. Ideally, a useful organisation of the geographic space in this context must meet three criteria:
All territory should be covered
Units should not overlap
Units should be homogenous in terms of a target attribute (size of the resident population or something else).
UK geographies like the Output Areas or the Local Authority Districts are designed to meet these criteria and are therefore suitable for statistical analysis (less so for spatial cognition). Interestingly, the European framework NUTS aims precisely at creating some order in the messy administrative geographies of EU member states, providing a useful way to think about their commonalities and differences across countries, many of which have similarly intricate administrative geographies (while allowing interoperability and harmonisation of statistical data across different countries).
Choosing the appropriate geography for this project was therefore far from a trivial problem, and the most flexible approach consists of supporting multiple frameworks. Our solution was to identify the location of the museum as precisely as possible in terms of latitude/longitude, so that this location can then be used to assign the museum to any geographic unit., supporting different types of aggregation and analysis.
Organising ‘location’ in the database
The heterogeneous and asymmetric structure of the UK’s administrative geography also had implications for how we designed the database. We had originally intended that the search or browse facility for location would be arranged as a hierarchy of descending size or administrative importance. Following my investigations in administrative borders, I realised that there was no consistent hierarchy, and each country needed its own location logic to be defined. How then to proceed?
Throughout the research, the project co-investigator Professor Alexandra Poulovassilis has adamantly argued that we should not simplify complex data when designing the database. The search and browse functions should be able to encompass and manage some of the messiness of organisation in the real world. Accordingly, our menu of location was organised according to the separate hierarchies of the country in question. A drop-down menu shows England, Northern Ireland, Scotland, Wales, Channel Islands and Isle of Man (the latter two entities are Crown Dependencies rather than part of England). Clicking on Northern Ireland, Scotland, Wales shows their district councils, councils, or unitary authorities as appropriate. England subdivides into regions, then into a mixture of unitary authorities, counties and metropolitan counties, with the latter having the further sub-categories of districts. The region of London divides into the City of London and boroughs. Even though it is not symmetrical, this layout has the advantage of using recognisable sub-divisions, and of acknowledging the differences between the administrative geography of each country.
Identifying datasets
Having decided to use an administrative geography and having agreed that we would not attempt to simplify the differences between the four countries, we then needed to find datasets that would facilitate the organisation of our data. Once again, this involved something of a learning curve and I now know that two types of datasets are required. The first correlates administrative boundaries with postcodes (which we’d collected for each museum) and thus links each museum to a district, council area or region as required. The second dataset enables that information to be visualised in the form of a map.
Datasets that contain the coding for administrative boundaries and their visualisations are devised and available from several organisations, most notably the National Offices of Statistics. However, data collection and analysis within the UK is complicated by devolution. In some cases, the datasets cover two countries or even all four, but generally, the datasets relate to the individual countries of England, Ireland, Scotland and Wales, and to use non-computing terminology, these need stitching together.
A further issue arose in that we needed to find a way to map our data, but we also wanted to import other kinds of data to inform our findings, For instance, we planned on importing census data and using that to make links between museums and the geo-demographic contexts in which they were founded. This meant that we had to choose datasets for locations that would be compatible with any datasets that we may use in the future. In short, we needed to know if we would import additional data in the future, and if so what. It was at this point that we realised we needed expert help and were fortunate enough to have Dr Andrea Ballatore a specialist in geographic information science join the team. He advised on how the different datasets could be combined and also recommended that we use the same administrative framework as the Office of National Statistics as this would allow us to cross-reference our data. Since then the process of mapping museums has proceeded much more smoothly.
Administrative and ordinary geographies
The problem of using current administrative geographies is that they are not always in common usage. For instance, I had not previously encountered English unitary authorities and would never think to look for ‘Liverpool City Region’ when I could look for ‘Merseyside’. The database had to support analysis (i.e. link museums to the correct administrative unit in order to generate accurate statistics) and thus we had to use the relevant geographies, but it also had to support spatial cognition (i.e. help users understand where a museum is using their prior knowledge of the UK). Our solution was to introduce a TownorCity field in the search pages. Users could thereby search by administrative area or on a more intuitive basis by towns or cities.
Since our blog entry on building the database, we have held a series of user trials of the Mapping Museums database and the Web Application through which the database is accessed. These trials have given us much useful feedback for improving the system as well as a positive endorsement of the overall development approach. For example, museums experts told us that the system is “useful to anyone wanting to understand the museum sector as this is the closest we’ve ever been to getting a full picture of it”, “intuitive to use”, “the Museum equivalent of YouTube”.
The figure on the left shows the architecture of our system. It has a three-tier architecture comprising a Web Browser-based client served by a Web Server connecting to a Database Server. The database is implemented as a triple store, using Virtuoso, and it supports a SPARQL endpoint for communicating with the Web Server. The system currently comprises some 28,600 lines of Python code, as well as additional scripts consisting of 25,800 lines of JavaScript, HTML pages, and other source files.
Usage of the database and Web Application by the project’s researchers has already led to insights about periods and regions that show high numbers of museum openings or closings, changes in museums’ accreditation and governance status over the past 60 years, and popular subject areas. There will be two more years of detailed research, both qualitative and quantitative, building on this first phase of research.
The qualitative research is comprising both archival and interview-based work. The quantitative research is investigating correlations between high rates of openings or closings of museums and attributes such as accreditation, governance, location, size, and subject matter. The new attributes Geodemographic Group/Subgroup and Deprivation Index are enabling new analyses into the demographic context of museums’ openings/closing, including cross-correlation of these aspects with the other museum attributes, and hence the charting of new geographies of museums.
Ongoing development work is extending the Web Application into a full Website to showcase the outcomes and findings of the project. We are also developing a new web service to allow the capture of data updates relating to existing museums and the insertion of data about new museums. There will be forms allowing the public upload of such data which will be subsequently validated by the project’s domain experts before being inserted into the database.