Freddie Fox (1913-1990) inherited his father’s Dublin cigar business, and expanded it to an international concern. In 1992 JJ Fox acquired the older business of Robert Lewis, an eighteenth-century tobacco dealer based in St James’s, London. This museum devoted to smoking history is in the London shop’s basement.
The museums sector generally concentrates on current practice and developments; it does not keep longitudinal data that would enable academics and museum professionals to trace patterns over time.
The result is that commentary on closure is focussed on the very recent past and lacks a broader perspective that could add insight to contemporary analyses of this phenomenon. As part of the Mapping Museums project we have built a dataset charting the development of UK museums since 1960, and we have used this to draw the first substantive picture of museum closures over time.
At the outset there are two important points to address relating to museum closure that we’ve encountered while building the dataset.
The first concerns data collection. Given the historical focus of the project, a great difficulty has been finding information regarding precise years of closure. Recent closures and closure of well-established museums are fairly well documented. The real difficulty has been tracking down information for smaller, grassroots, regional museums – particularly those that closed 15, 20, or 25 years ago.
We have conducted extensive searches via websites, historical guidebooks, and museum directories. When these were exhausted we sent emails or made telephone calls to individuals or groups, including regional museums services, local history societies or town clerks. We sent hundreds of communications in this way. Sometimes our contacts provided definitive information on when a museum closed; sometimes they could not.
For opening and closure years we have been able to generate accurate information for about 90% of museums. This has been an unprecedented undertaking and has drawn together information from a disparate range of sources. For the remaining 10% we’ve employed year ranges or made informed estimates, which we have mitigated with appropriate statistical methods in our analysis¹.
The second point is that, almost counter-intuitively, closure is difficult to define.
For example, if a museum ceases regular public opening hours but remains accessible in some form, should we continue to consider it open? This happened at Leith Hall House in 2009, which is now open for guided tours only. As the property is still accessible and continues to be advertised by its owner, the National Trust for Scotland, we consider it open, but this is, of course, debatable.
Furthermore, is closure is connected to premises? When a museum merges into another site, should we consider it closed or just having changed location? For example, in 2015 the Clockmakers Museum moved from its own premises into the Science Museum. Should we mark the museum closed and the collection a constituent part of the Science Museum? Its website indicates that the Clockmakers Museum retains a distinct identity. As such, we have kept it open.
The most difficult conceptual aspect to closure is that some museums don’t close per se, they gradually cease to exist. This is often the case with farm museums, where exhibitions of rural bygones are supplanted by other visitor offers (e.g. farm shop, petting zoo) so that the museum display doesn’t close with a thud at a specific moment, but gradually slips away without a whimper. In such instances we have contacted owners and discussed how best to record such forms of closure.
Generally, we have looked at closure on a case by case basis and tried to balance continuity versus change. If an effort has been made to keep a museum alive in some form we have tended to respect that, although we would log instances of material change, such as if a local authority museum was taken over by a volunteer group, etc.
Analysis
Turning to the analysis, it should be noted that these are preliminary results that will be refined prior to more formal publication, so some of the numbers presented here may be subject to slight change.
In total, we have recorded nearly 4,000 museums as being open to the public in the UK between 1960 and 2017, of which around 3,250 are currently open. This is a significant increase on the Museum Association’s estimate of 2500. Our larger number is partly due to the fact that we have a more encompassing definition of what a museum is and count unaccredited museums that may not be included in other surveys.
The figure of 3,250 open museums means that since 1960 there have been about 750 closures. This is around 20% of the total.
First let’s begin by considering the rate of closure over time.
Figure 1: Plot showing rate of museum closure in the UK by year, 1960-2017
This is a simple smoothed line plot showing the number of UK museum closures per year since 1960. There are two types of plot used in this analysis: smoothed line plot (which shows average figures and is best for perceiving general trends) and spiky line plot (which shows precise figures for specific years).
As you can see in Figure 1, peaks in closure begin around the mid 1980s (with an average 13 closures per year) with another in the late 1990s (with an average 20 closures). Following the economic crisis in 2008, the closure rate accelerates, peaking in the last few years with closures averaging 30 per year.
Figure 2: Plot showing rate of museum closure in the UK per year, 1960-2017
Figure 2 shows closure information for specific years; the highest annual number of closures we recorded was 39 museums in 2015.
A particularly significant finding from this data is that it demonstrates that around 200 museums have closed since 2010. This provided an interesting contrast to the Museum Association’s figure of ‘at least 64′ closures over the same period, cited in their Museums in the UK 2017 report.
It is clear from these graphs that closures are rising more steeply in the current period than at any point since 1960.
However, if we look at these figures in the wider context of museum opening we get a different perspective.
Figure 3: Plot showing museum openings and closings in the UK, 1960-2017
This smoothed line plot shows the annual number of UK museum openings (in green) and closures (in red) since 1960. It demonstrates that while closure rates are increasing, they are doing so in the context of a sector that until very recently has been consistently expanding.
This data substantiates the rapid expansion of museums during the 1970s and 1980s, which is often termed the ‘heritage boom’. Since the early 1990s the rate of openings has declined but they have still outpaced closures in every year except four.
Figure 4: Plot showing museum openings and closings in the UK, 1960-2017
This spiky line plot shows more clearly that for every year between 1960 and 2014 (with an exception in 2010), more museums opened than closed, meaning the sector expanded. The result is that the sector peaked in terms of total number of museums in 2014.
However, in 2015, 2016, and 2017 this trend was reversed by marginal net losses. What is particularly striking is that 2017 saw the lowest number of museum openings in the UK since 1960. This figure is 16 museums per year.
Generally speaking, this would appear to indicate a picture of robust growth over the longer term. From approximately 900 museums in 1960, the sector has seen a 260% net gain to the current situation in which numbers have begun to plateau.
However, drilling down into the data reveals some divergent trends.
For example, while the sector has grown substantially in this period, its composition has markedly changed.
Figure 5 shows number of closures by decade based on museum governance. (Note: Here we are using a simplified governance measure: ‘independent’ includes private museums or those run by trusts or foundations, while ‘state’ comprises national and local authority museums).
If we consider closure by governance, we can see that greater numbers of independent museums are closing than state run museums.
Figure 5: Museum closure by governance per decade in the UK, 1960s-2010s.
This may be expected, particularly given that smaller, private museums are often financially shaky ventures. For example, between 2010 and 2017, our data shows that over 150 independent museums closed compared to roughly 60 state run museums.
However, a more significant observation is that in proportionate terms, the closure of state run museums is higher than that of independents.
Figure 6: Plot showing percentage proportion of museum closure by governance in the UK, 1960-2017
This plot shows museum closure as a proportion of governance type.
As we can see, proportionate closure of state run museums begins to outpace closure of independents around 1995. Since 2000, the average proportionate rate of closure of state run museums has been 1.1% per year compared to around 0.7% for independents.
If we examine the data further we can see significant spikes in 2011 (when 1.8% of state run museums closed), 2015 (with 1.5%) and 2016 (with 2.4%).
When we factor in openings over this period, we also see that fewer state run museums have opened than closed since 2000. The result of this is that the state run museums sector has seen a net decline of around 14% in this period
Around 5% of this decline is accounted for by museums lost to closure while 9% is museums transferred by local authorities into trust status (which we have termed ‘hybrid’ status). We are still calibrating this aspect of our data and this figure could be higher.
In contrast, since 2000, the independent museums sector has seen a net growth of 9%.
We can see how these trends have changed the composition of the sector over the longer term.
Figure 7: Cumulative open museum by governance in the UK, 1960-2017
According to our data, in 1960 there were around 900 museums, of which 40% were state run and 50% were independent. In 2017, of the 3,250 museums we recorded, roughly 22% are state run whereas 70% are independent. As a result, we can see that the State’s direct contribution regarding the provision or management of museums is shrinking while the sector is becoming dominated numerically by independents.
Conclusions
These are some of the preliminary findings from our research.
They indicate that from 1960 onwards the museum sector expanded continually until 2010, with a slight decline in that year, but then saw further growth until it peaked in 2014. This represents 54 years of museum growth.
However, around 200 museums have closed since 2010 and for the last 3 years closures have outpaced openings. Significantly, 2017 saw the lowest rate of museum opening since 1960.
It is important, however, not to conflate the overall growth of the sector with what is happening within it. It is clear that museum growth has been principally driven by the independents and that they now ensure that the overall number of museums in the sector remains relatively static.
It is also clear that the decline in the number of state run museums – through closure or change in status – has been considerable.
This raises significant questions about the type of skills, facilities, and experiences, that are being lost with the contraction of State run museums. This issue is not just one of closure but the loss of public sector institutions.
Hopefully these initial findings provide insight into the development of the sector over the longer term and help inform the conversation about the impact of the current age of austerity on the museums sector writ large.
We will be releasing further results as we continue our analysis, so please subscribe for updates or follow us on twitter: @museumsmapping
¹ The results on which this analysis is based have been weighted to account for the uncertainty in the data. When more accurate data is not available, we use a date range for the opening and closing years of museums. For example, if we know a museum was opened between 1965 and 1975 but are unable to specify a particular year, the range of possible years (in this case 10) will be divided equally and the probability (0.1 in this case) will be added to the results for the years in the date range. This avoids over-representing individual museums, and provides a more realistic quantification than a simple count.
The National Fencing Museum was established in 2002 in by Malcolm Fare, a fencer and fencing historian. It includes displays of fencing equipment, paintings, prints, books, and all kinds of ephemera.
Patrick Cook, the founder and owner of the Bakelite Museum, started collecting plastic when he was an art student in London. Among other things, he used his collection to hold a series of Bakelite picnics, where the crowd ate food off Bakelite plates, drank tea from Bakelite cups, and listened to music played on Bakelite instruments. In 1983, Cook opened a Bakelite Museum, and in 1994 he moved the collection to its current location in the village of Williton in Somerset, opening to the public the following year. The museum is about to move again, and before it does so, we wanted to film the museum in its current incarnation.
The Mapping Museums project was motivated, in part, by the lack of documentation of small independent museums. Our research indicates that just over 2,500 independent museums have been open in the UK at some point since 1960 (This figure is higher if we include museums managed by the National Trust and other national organisations). These new independent museums focus on diverse subjects – lead mining, Methodism, local history, and Bakelite, and in doing so they make an important contribution to the cultural life of their local areas, and collectively, that of the nation. However, these small independent museums often run on a limited income, which means that they do not have the resources to document their holdings, publish catalogues of their exhibitions, or to keep an archive. Thus, if a museum moves premises, or closes, they may leave little trace behind.
The Mapping Museums project aims at documenting all the museums that have been open in the UK between 1960 and 2020. So far, the research has focused on identifying museums and on providing an overview of how the independent museum sector has emerged and developed. As our work continues, however, we will be looking at individual museums in more detail. This short film, which was made in collaboration with the Derek Jarman Lab, forms part of that enquiry.
Hopewell Colliery Museum is in the Forest of Dean in Gloucestershire. Mining is an ancient tradition in the forest and those born there can exercise their rights to mine coal, iron ore, ochre and stone. The museum includes a working mine, through which visitors can take a guided tour.
The Buxton Transport Museum was relatively short-lived, open for only three years. It was established in 1980 by Peter Clark, a vintage car enthusiast. The site is now occupied by Buxton Mineral Water company.
Sign for The Douglas Museum installed at Castleton Visitor Centre, 2017
The Douglas Museum was the brainchild of Randolph Osborne Douglas, who created it in his home in Castleton, Derbyshire with his wife Hetty. Douglas was a silversmith, locksmith, and amateur escapologist with the stage name of The Great Randini, inspired by his childhood hero Houdini. His collection included miniature houses, locks, models of the world’s largest diamonds, a variety of Houdini ephemera, and many other curios.
Douglas opened his museum in 1926. After he died in 1956, Hetty continued to run the museum until her death in 1978. The collection was transferred to Buxton Museum and parts of it are now on show in the small museum at Castleton Visitor Centre.
Douglas Museum showcase at Castleton Visitor Centre, 2017.
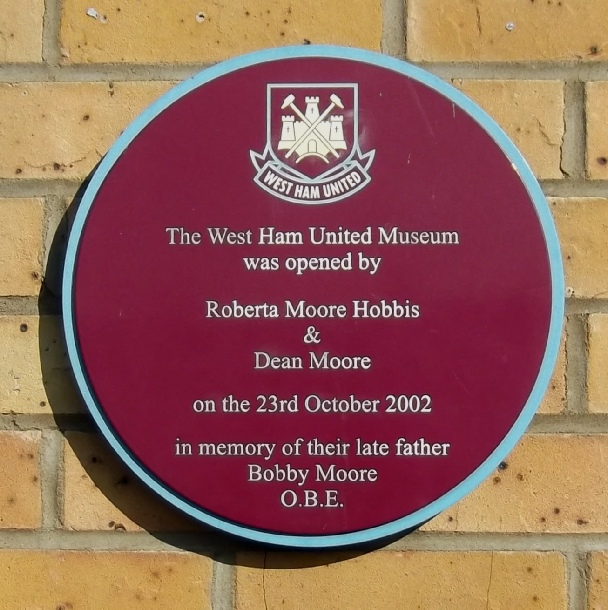
An area that initially passed us by on the Mapping Museums project was the prevalence of sports museums. While we recorded the more obvious, high-profile venues such as the MCC Museum and National Football Museum, we were unaware of the increasing numbers of club museums. This growth has occurred across team sports, such as rugby and cricket, but is particularly evident at football clubs. The development has not been prompted by clubs’ newfound interest in preserving their heritage – after all, there have always been trophy rooms to display cups and medals – but in opening up those collections to their supporters and the wider public. This seems to have begun with the introduction of stadium tours in the late 1990s/early 2000s, as part of an effort by clubs to market themselves as venues for more than a couple of 90 minutes matches each week. As such initiatives have taken off, club museums have increasingly become attractions in their own right. Indeed, interest in club history can be gauged in part by the success of exhibitions hosted in local museums, of which there have been innumerable in recent years. Exhibitions like that at the Dorman Museum in 2012, which celebrated the 25th anniversary of the ‘rebirth’ of Middlesbrough Football Club, are testament to the depth of local attachment to their teams; a feeling that clubs may well seek to tap into to develop a more expansive museum offer moving forwards.
Further, there is now greater awareness of the importance of this history across the museums sector, with the recent launch of Sporting Heritage, a project in some ways similar to our work, which maps various sporting collections held in museums throughout the UK. Hopefully, their work will act as a focal point to help support the growth and development of these emerging sporting attractions.
Below we have compiled our own list of (mainly Premier League) football clubs that have museums – either their own or supporter run – and those with plans to develop them. If we have missed any club museums, however small, please do let us know via twitter @museumsmapping or in the comments below!
Newcastle United FC
Small museum exhibition included in Stadium Tour. Recent record-breaking exhibition of club history at the City’s Discovery Museum.
On Friday 26th January, the Mapping Museums project reached the end of its first phase, and for us, it felt like a momentous date. For the last fifteen months Dr Jamie Larkin and I have been compiling a huge dataset of all the museums that have been or were open at any point between 1960 and now. That information has now been finalised and handed over to the computer science researcher to be uploaded. In the coming weeks, we will be able to start analysing our material and generating findings about the past sixty years of museum practice in the UK.
The dataset of museums synthesises information from a wide variety of different sources. We started with DOMUS (The Digest of Museum Statistics), which was a huge survey of museums conducted in the mid 1990s and with the 1963 Standing Committee Review of Provincial Museums. These captured a large number of museums that were open in the mid to late twentieth century, but have since closed. We then added current records and information from the Arts Council England (ACE) accreditation scheme, and from the national records gathered by from both Museum Galleries Scotland (MGS), and the Welsh Museums Libraries Archives Division (MALD) and the Northern Ireland Museums Council (NIMC), since these lists both include non-accredited venues museums. The Association of Independent Museums (AIM) gave us a list of the museums that have been members their membership records and we also managed to find the results of a very old survey that they had conducted in the 1980s in the University of Leicester Special Collections library. This was research gold for it identified very small museums that are extremely difficult to trace once they have closed.
We included around half of the historic houses that are listed in the Historic Houses Association guidebook, and a number of properties that are managed by English Heritage, Historic Environment Scotland, or CADW. Deciding which venues reasonably constituted museums was a difficult process and one that we did in consultation with senior managers and curators of those associations, colleagues from the Museums Development Network and with the ACE accreditation team, although the final decisions were our own.
In the course of researching my last book Micromuseology: an analysis of independent museums, I had compiled a list of very small idiosyncratic museums, and these were added into our rapidly growing list, as were a surprisingly long list of museums that were listed online but not in any of our other sources. We then checked our dataset against the Museums Association ‘Find A Museum Service’ and against two huge gazetteers The Directory of Museums and Living Displays and The Cambridge Guide to the Museums of Britain and Ireland edited by Kenneth Hudson and Ann Nicholls in 1985 and 1987 respectively. Finally, we also consulted the Museums Association Yearbook at five yearly intervals from 1960 until 1980 and also a variety of publications that listed historic houses that were open to the public. In all cases, any venues that we had previously missed were added.
Having established a long list of museums we needed to ensure that we had a correct address, and the opening and closing dates for each venue. We also wanted to establish its governance, whether it was national, local authority, university, or independent, and if the later, if it was managed by a charitable trust or by a private group. Finding this information necessitated months of emailing and telephone calls, and we often ended up speaking to the children of people who had founded museums, or to members of local history associations in the relevant area. Even so, the process of compiling our dataset was not yet finished for we also needed to classify each museum by subject matter. In order to do this we devised our own classification system and considered each venue on an individual basis. It is little wonder that major museum surveys are infrequently undertaken.
The next phase of the research is analysing the data, so watch this space for updates. The first findings on museum opening and closure will be presented at ‘The Future of Museums in a Time of Austerity’ symposia at Birkbeck on February 24th 2018. We will also be tweeting about interesting aspects of our analysis, so don’t forget to follow us @museumsmapping on twitter.
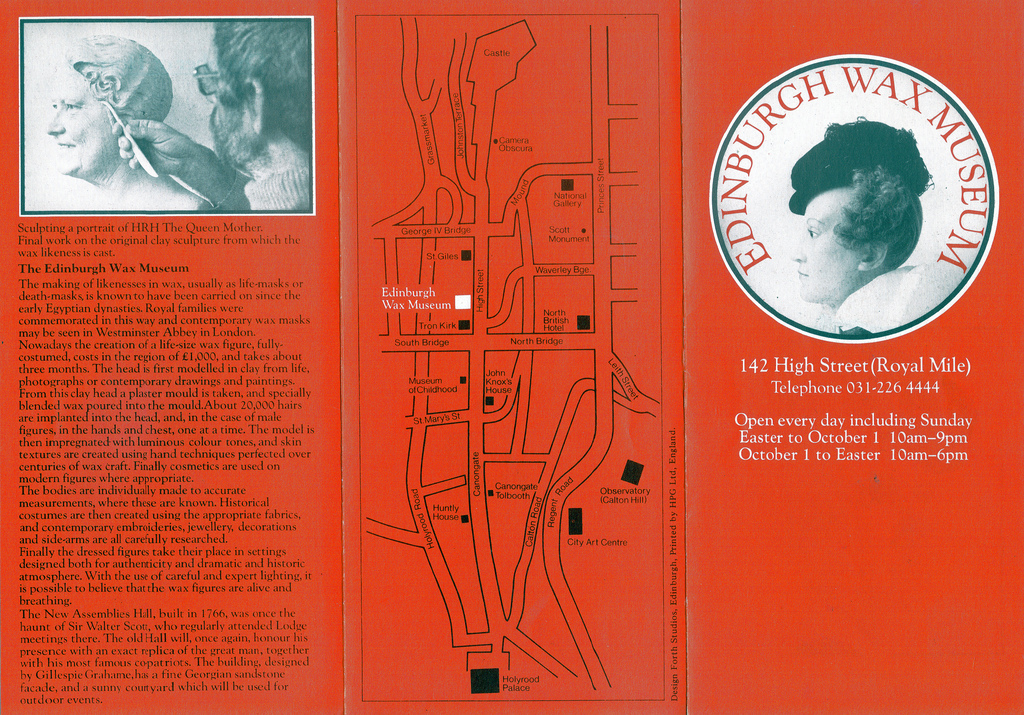
Edinburgh Wax Museum opened in 1976 and was soon attracting more than 230,000 visitors a year. Displays included Scottish historical figures, fictional characters, and, as you might expect, a chamber of horrors. The museum was curated by Charles Cameron, a professional magician, who also performed as Count Dracula in night-time shows in the Castle Dracula Theatre on the top floor.
Despite its popularity the owners decided to sell the premises for office development and the museum closed in 1989, joining the ranks of lost wax museums. The premises were up for sale again in 2008, but it seems nothing came of plans to reopen the museum.