Categories
Lab News

Major Changes to the Mapping Museums Lab Database

We’re delighted to announce that key functions from the original Mapping Museums Lab database have now been fully integrated into our new web application.

We are very grateful to Art Fund for helping fund additional development work, which has enabled us to extend and strengthen the Mapping Museums Lab resource for the benefit of the wider museums and heritage community.

This update brings together, in one place, the rich data from our first major project — a comprehensive database of all museums open in the UK from 1960 to the present — with our second major strand of research: detailed information on museums that have closed, including reasons for closure and the outcomes for their collections. For the first time, users can seamlessly explore all the Mapping Museums Lab data in one site.

Responding to input from our sector evaluation sessions, the addition to the web application offers a more flexible and intuitive user experience. You can now:

  • Search for individual museums using free text
  • View detailed information for each museum
  • Generate and search across lists of all museums in the database
  • We’ve also refreshed and expanded our accreditation data. Records have been updated and accreditation numbers added, making it easier to track institutional status and align our data with other resources and sector standards.

Whether you’re a researcher, policymaker, sector professional, or independent scholar, the new platform is designed to make the data more discoverable, usable, and interconnected than ever before. We look forward to seeing how you use it.

The original Mapping Museums database will no longer be updated.

Categories
Lab News Museum Closure in the UK Publications

New article on museum closure data

The Mapping Museums Lab has just published an article in the Journal of Open Humanities Data about our project on museum closure. If you are interested in finding out more about how we collected and managed the data, the article is open access and free for everyone to read: A Dataset of Collections Dispersal Following Museum Closures in the UK During 2000–2025.

Categories
Lab News

The Mapping Museums Database: Bad and good news

Do you use the Mapping Museums database? If so, we need your input.

Bad News: The Mapping Museums Database is now almost six years old, which is elderly for prototype software. Redeveloping a database is expensive and our funding has come to an end. Thus, we have made the decision to archive the original Mapping Museums project website and database. It will still be available online, but the data will not be updated and the system will not be supported after December 2025.

Good News: We developed a new web application as part of our most recent research on museum closure and collections disposal. This application allows users to search and visualise the new data.

The new web application will also offer a slimmed down version of the Mapping Museums Database, and the information will continue to be updated.

We will not be able to transfer the complete the Mapping Museums Database to the new web app, so we need to know what functions are essential for you.

Please can you tell us how you use the Database?

For example:

Do you use Browse or Search to look for museums?

Do you use the quick search or the advanced search?

What information do you look for? museums’ postcodes? governance? size?

Do you use the information on social deprivation or the geo-demographic areas?

Do you ever look at notes?

Do you use the Visualise functions, if so, which ones?

What can you not easily do without?

Any information on how you use the Database and what you would like to retain will help us ensure continuity of service. We appreciate you taking the time to respond. Please send any feedback to mappingmuseums@bbk.ac.uk

Categories
Lab News

Mapping Museum Lab data incorporated into ONS dataset

Image: Office of National Statistics, 2025

Mapping Museum Lab Data Incorporated into ONS Dataset on UK Museums

We are pleased to announce that data from the Mapping Museum Lab has been incorporated into the latest report from the Office for National Statistics (ONS) on the number of museums across local authority districts in the United Kingdom. The dataset can be accessed here.

The Mapping Museum Lab is committed to advancing research on the distribution, development, and classification of museums in the UK, with a particular emphasis on smaller and independent institutions that are often underrepresented in official datasets. The inclusion of our data in this ONS report underscores the significance of our research in providing a more comprehensive and accurate picture of the UK’s museum sector.

The integration of our dataset enhances the ability of policymakers, cultural organisations, and researchers to analyse the geographic distribution of museums, contributing to broader discussions on accessibility, funding, and the role of museums in civic life. This collaboration highlights the importance of robust data collection in shaping cultural policy and ensuring informed decision-making.

We are encouraged by this recognition of our work and look forward to further opportunities to contribute to the study of the UK museum landscape.

Categories
Lab News Publications

Mapping Museums data used by ONS

The Office for National Statistics (ONS) used Mapping Museums data in a new analysis of public access to sports facilities, supermarkets and museums.

Of museums, they write:

Urban areas, in particular large cities, have fewer museums relative to their population than rural areas. Seven of the ten local authorities with the fewest museums per 100,000 people in the UK are London boroughs. Those local authorities with the higher proportion of museums tend to have small not-for-profit local history museums.

https://www.ons.gov.uk/peoplepopulationandcommunity/wellbeing/articles/moreadultsareactiveinareaswithahighernumberofsportsfacilities/2024-03-07

The new release includes a report and four datasets, including the number of museums across Local Authority Districts (LAD) in the United Kingdom.

Categories
Lab News Publications

Museum Maps at the Royal Geographical Society

The Royal Geographical Society (with IBG) has selected our museum mapping work as an example of notable geo-visualisations.

‘The visualisations created show huge geographical inequalities in the sector, with some areas attracting a lot of museums and others very few.’

Read more here: https://www.rgs.org/about-us/what-is-geography/geovisualisation/mapping-museums

Categories
Lab News

Funding success for the Mapping Museums team

We are pleased to announce that the Arts and Humanities Research Council has awarded £1million to the Mapping Museums research team for their project ‘Museum Closure in the UK 2000-2025’.  

The new research will use trans-disciplinary methods to analyse closure and collections dispersal within the UK museums sector. Its aim is to examine the geographic distribution of closure, to better understand types of closure (e.g., whether museums are mothballed or disbanded), and to document the flows of objects and knowledge from museums in the aftermath of closure. We will investigate the afterlife of collections, find out if museum exhibits are scrapped, sold, stored, or re-used, and examine ‘outreach’ and temporary museums. A Knowledge Base will be designed to model and store the collected data, and visualisations and analyses of the data will be developed. Above all, we aim at critically reassessing notions of permanence and loss within the museums sector.  

‘Museum Closure’ is based at Birkbeck, University of London and at King’s College London, and will run for two years, beginning in October 2023. It is led by Fiona Candlin, Professor of Museology, who will be working with co-investigators, Dr Andrea Ballatore (King’s College London), a specialist in cultural data science, Alexandra Poulovassilis, Emeritus Professor in Computer Science, and Peter Wood, Professor in Computer Science. The post-doctoral researcher is Dr Mark Liebenrood (museum history) and we will be recruiting a second post-doctoral researcher in data science.

(Image modified from original, by elston on Flickr)

Categories
Lab News

Mapping Museums is Dead. Long Live Mapping Museums

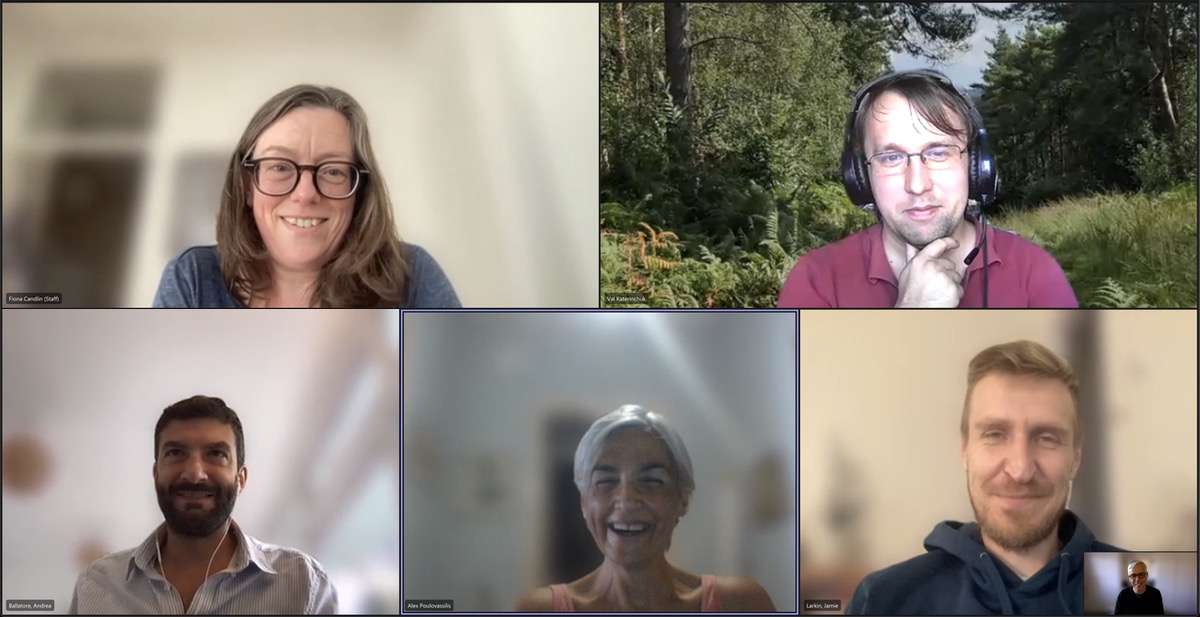
(Header image: The Mapping Museums team in an online meeting. Clockwise from top left: Fiona Candlin, Val Katerinchuk, Jamie Larkin, Mark Liebenrood (inset), Alexandra Poulovassilis, Andrea Ballatore)

Today marks the official end of the Mapping Museums research project. There were certainly times when I thought that we’d never finish. The process of collecting information on museums open in the UK since 1960 sometimes felt interminable, and I began to regret museums opening almost as much as them closing because it means we had to enter them into the database. Writing the report on data, a statistical analysis of changes within the UK museum sector, seemed to take years, as did my attempts to work out local authority hierarchies across the UK. I could have happily skipped those learning curves. And I think my colleagues felt similarly as they collected and checked museum details, created visualisations of data, discovered and fixed bugs in the system, and coded hundreds of thousands of words of interview transcripts.

It has been a huge and at times trying enterprise. Yet the moments of complaint were utterly outweighed by the pleasures of the research. I’ve learned a lot and seen how quantitative and qualitative research can be mutually informative and how interdisciplinarity can push research in new directions. In developing data and data visualisations, I’ve been forced to think more precisely than before about how museums are defined and classified, and the ethics of doing so. My sense of the UK museum sector has changed. I stopped thinking of it as a relatively bounded and stable territory and started seeing it as a mass of overlapping entities that chopped and churned. I’d never really thought about museums closing before, whereas now they seem to be much more fragile entities. And the interview-based work made me rethink the whole notion of a museum founder: not only the notion of the individual founder beloved of conventional institutional narratives, but the DIY curator that features in popular journalism and grass roots histories.

I am also enormously proud of what we have collectively achieved. If you haven’t already, do please have a look at the website, which provides access to a searchable database of over 4000 museums, the project report, articles, and many other resources including transcripts of interviews at around fifty small museums. The final monograph, provisionally titled ‘The People’s Museums’ is finished pending peer reviews and, fingers crossed, will be published sometime next year.

That work has depended heavily on the interest, input, and forbearance of too many people to name, although I would like to thank three groups and one individual who have been particularly important: the Museum Development Officers who questioned, checked, and contributed to our data; the hundreds of museum volunteers and staff members who explained how and why they set up their own museums; the Advisory Board who helped us negotiate the museum sector; and Phil Gregg made sure the systems were maintained and that we didn’t lose our data. We are very grateful to all of them. And at the risk of lapsing into an Oscars-style speech, I’d also like to take the opportunity to thank my colleagues in the research team: Andrea Ballatore, Toby Butler, Val Katerinchuk, Jamie Larkin, Nick Larsson, Mark Liebenrood, Jake Watts, and especially the Co-Investigator Alexandra Poulovassilis. It really has been a pleasure to work with such an expert and committed group of people. For me, the project has been more than the sum of its parts: something that only happens when there is genuine collaboration.

Mapping Museums is dead but Mapping Museums lives on. We are working to keep the database up to date for as long as possible. It has been widely used and we want to keep it operational. Doing so depends in part on the ongoing contribution of others, so please carry on sending us updates and edits (contact us here). Several of us are also continuing to work together on the new ‘Museums in the Pandemic’ research project. That will conclude in the summer of 2022 with a report that leads on from the Mapping Museums research. We hope to launch the publication with a seminar and party to make up for the one that we missed in March 2020. You are all invited.

Fiona Candlin

Categories
Lab News Publications

The Mapping Museums Website and Database is Now Live

Well it’s not the launch we’d hoped for. We were supposed to mark the event with a panel discussion and wine reception at London Transport Museum, and for weeks I’ve been looking forwards to hearing what the speakers had to say about our report. I’ve been borderline worried about the possibility that we might have overlooked something important or that there would be an error in the database that had hitherto gone unnoticed, and I’ve imagined us all afterwards, happily drinking wine at the reception, toasting each other for our success. We had 120 delegates booked in, coming from all kinds of interesting places, and a long waiting list. I’d even bought a new outfit. Sigh. It is disappointing but given the current spread of Covid-19, it was better to err on the side of caution and to postpone the event.

On the up side, we have decided to go ahead and publish. So, if you have had to self-isolate and need some alternatives to Netflix, then there is a cornucopia of museum information just waiting for you.

www.mappingmuseums.org

The website has links to podcasts and lectures, to a series of academic articles, and to transcripts of dozens of interviews with the founders of museums. It’s got sections on how we collected the data and built the database, on our definitions of museums and our new subject classification system. Above all, there is the database: information on 4,200 museums that have been open at some point between 1960 and 2020. If you’ve always wanted to know where to find museums of food and drink, or how many railway museums there are in the UK, then the answer is now at your fingertips.

We have also published ‘Mapping Museums 1960-2020: a report on the data’, which provides a summary of the research and of our methods, and a guide to the findings from the data. This is where you’ll find information on the numbers of museums that have opened in the UK over the last six decades, when they opened, the subjects they covered, their governance, where they were, and if they closed. The report can be accessed through the Publications page.

I do hope that you will enjoy the website, and find the report and database useful. If you have any feedback on the project, and especially on how you’re using the information, then do please let us know.

Fiona Candlin

Image: First Flight of Space Shuttle Endeavour Launches — May 7, 1992, by NASA under Creative Commons licence

Categories
Lab News

Mapping Museums Database: New Developments

Since our blog entry on building the database, we have held a series of user trials of the Mapping Museums database and the Web Application through which the database is accessed. These trials have given us much useful feedback for improving the system as well as a positive endorsement of the overall development approach. For example, museums experts told us that the system is “useful to anyone wanting to understand the museum sector as this is the closest we’ve ever been to getting a full picture of it”, “intuitive to use”, “the Museum equivalent of YouTube”.

Following the user trials, we have made some improvements and extensions to the user interface, have incorporated data relating to some 50 additional museums, and have added three new attributes for all of the 4000+ museums in our database. The new attributes relate to the location of each museum and are Geodemographic Group and Geodemographic Subgroup and Deprivation indices (English indices of deprivation 2015, Welsh Index of Multiple Deprivation, and Northern Ireland Multiple Deprivation Measure 2017).

The figure on the left shows the architecture of our system. It has a three-tier architecture comprising a Web Browser-based client served by a Web Server connecting to a Database Server.  The database is implemented as a triple store, using Virtuoso, and it supports a SPARQL endpoint for communicating with the Web Server. The system currently comprises some 28,600 lines of Python code, as well as additional scripts consisting of 25,800 lines of JavaScript, HTML pages, and other source files.

Usage of the database and Web Application by the project’s researchers has already led to insights about periods and regions that show high numbers of museum openings or closings, changes in museums’ accreditation and governance status over the past 60 years, and popular subject areas. There will be two more years of detailed research, both qualitative and quantitative, building on this first phase of research.

The qualitative research is comprising both archival and interview-based work. The quantitative research is investigating correlations between high rates of openings or closings of museums and attributes such as accreditation, governance, location, size, and subject matter. The new attributes Geodemographic Group/Subgroup and Deprivation Index are enabling new analyses into the demographic context of museums’ openings/closing, including cross-correlation of these aspects with the other museum attributes, and hence the charting of new geographies of museums.

Ongoing development work is extending the Web Application into a full Website to showcase the outcomes and findings of the project.  We are also developing a new web service to allow the capture of data updates relating to existing museums and the insertion of data about new museums. There will be forms allowing the public upload of such data which will be subsequently validated by the project’s domain experts before being inserted into the database.

© Alexandra Poulovassilis, Nick Larsson, Val Katerinchuk