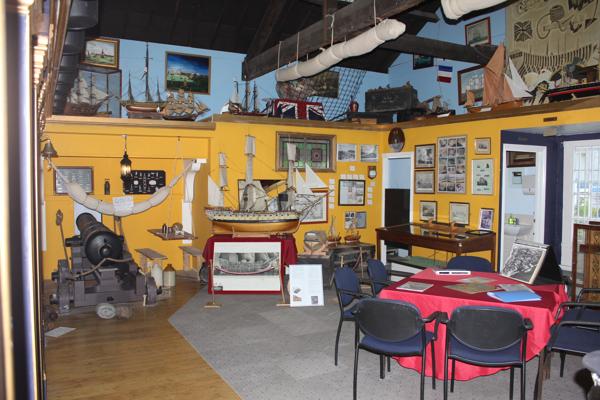
The Blue Town Heritage Centre is situated on an atmospheric Victorian high street on the outskirts of Sheerness on the Isle of Sheppey in Kent. Blue Town was a community built for dock workers and a high dock wall looms opposite the Centre. Unusually, the building combines a museum, cinema and a working music hall theatre.
Jenny Hurkett, the founder and manager of the Centre, converted a kitchen showroom she owned with her husband after screening a film on local history that attracted hundreds of visitors. She was motivated by a strong feeling that Sheppey’s history, including the docks and its role in aviation history, was being ignored by regional tourist authorities. Jenny discovered the building was on the site of the Criterion Music Hall (bombed in WW2) and they then rebuilt a theatre which is regularly open for music hall, variety shows, cinema screenings and conferences. Local prisoners were involved in the conversion work. She also established the Eastchurch Aviation Museum and chairs a network of museums in Swale.
The Heritage Centre covers various aspects of local history including the development of the docks at Sheerness; the Blue Town community (named after the blue paint from the dockyard used to protect the wooden houses); a local co-operative movement that predates Rochdale and other aspects of local and domestic history. Upstairs is a purpose-built gallery devoted maritime history full of models, tools, signs, maps and ephemera relating to the docks and the working life of the docker community. It also includes a reconstructed deck scene of the HMS Victory including a captain’s cabin and a gruesome surgeon’s room, complete with sawn-off legs. The centre also provides historic tours of the island and includes a café. It also has a role as community hub and often hosts groups with special needs, alongside their busy theatre and cinema programme.
Photo and text by Robin Newton-Clare and Toby Butler.
The Rifles Museum (also known as the Rifles Collection) is the regimental museum of The Rifles, the largest infantry regiment in the British Army. The Rifles were formed from four existing regiments in 2007 following re-organisation. The museum has an unusually modern focus, including recent campaigns in Iraq and Afghanistan and it is particularly concerned with the lived experience of the soldier in these campaigns.
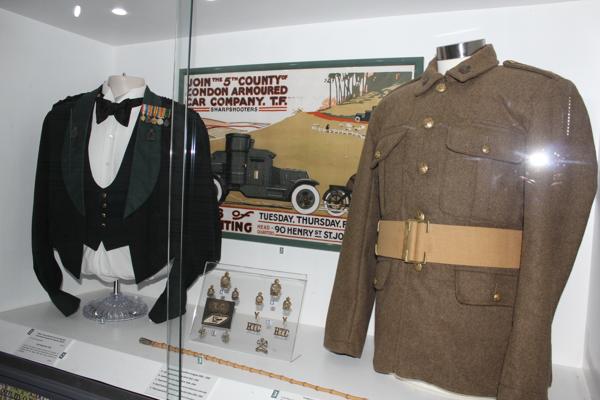
The exhibition begins with the formation of the regiment and focuses predominantly on Iraq and Afghanistan, where the Regiment has been serving. The display consists mainly of information panels and glass cases containing uniform, military equipment, ephemera and souvenirs taken by soldiers. There is a particular focus inter-cultural issues involved in working in these countries. It includes a display of Afghan life and features guides given to soldiers on local customs and useful phrases. The middle of the exhibition space contains a memorial and contemplation area, featuring a cross made of wooden pallets built in Afghanistan to remember members of the regiment who had recently died. The galleries are spacious and large artwork and photography were notable features compared to other regimental museums on the site. A merchandise area has regimental caps, sweatshirts and other clothing for sale. It also had an area for children to dress up in military uniform and sit on a quad bike for photo-opportunities. One display features Iraq ‘tour’ T-shirts featuring Basra Palace, where the Rifles were stationed for some time. The designs parody the famous Carlsberg advert: ‘Basra – probably the worst palace in the world’.
Exhibition at the Rifles Museum
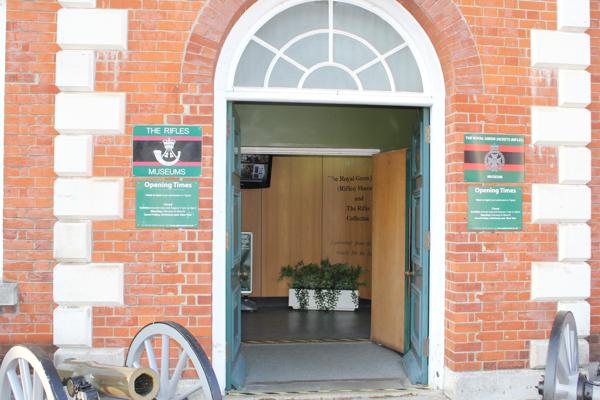
The museum, which opened in 2013, is close to the Rifles regimental headquarters at the Peninsula Barracks in Winchester. The Barracks are extensive buildings built in the early 20th century and are grade II listed, how housing several military museums alongside regimental offices and private flats. The Rifles Museum shares a building with the Royal Green Jackets (Rifles) Museum. The latter was one of the constituent regiments merged in 2007 to form the Rifles and has a much larger exhibition space over two floors including a huge model display of the Battle of Waterloo. The Rifles Museum is separately managed and has a smaller exhibition space on the ground floor. Visitors can enter the Rifles Museum directly (entry is free) but chronologically it focuses entirely on the period after the formation of the regiment in 2007 so visitors are encouraged to see it after the Green Jackets Museum (which focuses entirely on an earlier period, 1741 to 2007). The museum is run by the Rifles Regimental Museum Trust (registered as a charity in 2017).
The museum is dedicated to displaying uniform, medals, weapons, armoured vehicles, models and memorabilia relating to the Kent and Sharpshooters Yeomanry Regiment (the Kent Yeomanry were formed in 1794 and the Sharpshooters were formed in London in 1900. They amalgamated in 1961 and their squadrons are a part of the Territorial Army, currently based at Croydon and Bexleyheath).
The museum is situated in the extensive grounds of Hever Castle in Kent. From the outside it has the appearance of an army field camp, with two hall-sized khaki tents, a flag pole and an armoured car and field gun on display immediately outside; perhaps something of a surprise to visitors to the picturesque castle once owned by the Boleyn family. The tents cover much more permanent structures; one is an education room and the other contains a professionally designed and curated display space.
Inside the displays are chronologically organised, starting with the formation of the Yeomanry for the expected French invasion in 1794 and covering 200 years of regimental history up to the recent present (the squadrons have served in both Iraq and Afghanistan). This includes Gallipoli and the Great War (along with a life-sized recreation of a trench with sound and visual effects), World War II (which includes a hands-on recreation of a tank turret) and more recent conflicts. A registry section includes a list of all members of the regiment who were lost in action and a medal chest containing drawers of military medals donated by families. The museum is generally unstaffed and the displays have been designed accordingly.
The Museum was formed to preserve and display the property of the regiment, at the time of a regimental re-organisation. The museum opened to the public in 1966 at Squerrye’s Court in Westerham where it had a room for public display, given by the owner who was a serving member of the regiment. In 1985 It moved to historic property nearby, Hever Castle, and was similarly housed in a room above the keep. The Castle eventually paid for the construction of the new buildings in the grounds and the museum moved in 2015 after a £275,000 fundraising campaign for the interior fit-out by the Kent and Sharpshooters Yeomanry Museum Trust.
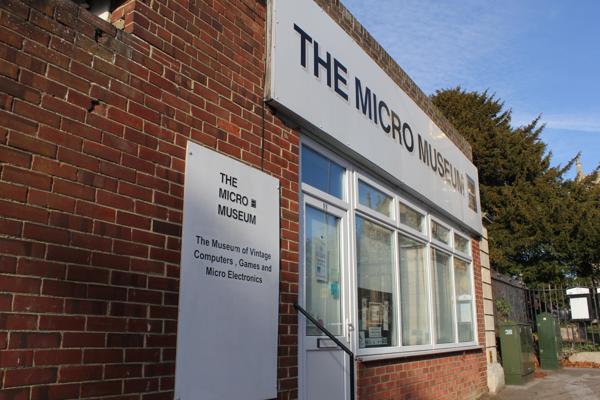
The Micro Museum encompasses vintage computers, video gaming and micro-electronics, such as mobile phones, small electronic games and toys. An array of working micro-computers and games consoles are available for visitors to try out, playing games and programming for as long as they wish. The museum also includes displays on the history of computing.
The museum is located in what used to be a stone mason’s workshop and later a plumber’s merchant, next to a large parish church in central Ramsgate. The reception area has a working BBC micro-computer and libraries of games and magazines on shelves. This leads to a large room which contains both the displays and a large array of different consoles and computers, set up to play at seated workstations. Wall posters cover the history of computing and floor to ceiling units display a huge array of computers and gaming consoles through the ages, mostly divided up by decade and in the case of smaller objects, by type (abacus, calculators, Furbies, mobile phones, LCD games, joysticks and so on). A Sinclair C5 is on display with accompanying information on the career of Clive Sinclair.
Interior of the Micro Museum
Carol and Mike Deer are semi-retired co-owners of the Micro-Museum and it is run as a small family business, with the involvement of a few volunteers. Mike used to work as a gallery attendant at the Museum of London. Carol describes the museum as a showcase for their personal collection of computers, games and electronics (‘basically anything that’s got a micro-chip in it that interests us’ from the 1970s to 2000. Mike started collecting in 1981 when he bought a Sinclair ZX81 in his mid-twenties. This led to buying more powerful home computers and electronic games. As consumer electronics developed so quickly computers and games were soon regarded as obsolescent and could be bought cheaply. The collection was amassed over 40 years and the museum opened permanently to the public in 2014.
The Flower Makers Museum is situated in a high street shop in Hastings old town (the building dates back to the 14th c.). At first sight it appears to be a shop selling artificial flowers, but there is a museum in the basement. The museum opened around 1991 and consists of a large part of the inventory stock of the Shirley Leaf and Petal Company: thousands of cutting tools and flower irons; presses for ‘veining’ fabric leaves; and a large array of samples, products and ephemera concerning the business.
The company manufactured silk flowers and leaves for shop displays, bridal dress decoration, confectionary, Christmas crackers and remembrance poppies. It was established in East London in the 19th century and moved to Hastings in 1910, where hundreds of homeworkers used hand tools to cut, press and make the flowers. The present owner, Brenda Wilson, bought the company in 1981 and moved the machinery and stock from an ex Mission hall to the present location. The business is still going and this is a working collection – the tools, samples and bales of fabric are used, and old presses on display have been converted to electrical power. Presently the company makes fireproof, artificial flowers and foliage for film sets, theatres and fashion designers.
Inside there is a shop counter and a room crowded with artificial flowers and decorative items for sale. Behind the counter there is a back room with a desk, work bench and Edwardian iron press, which is not strictly open to the public. Stairs, crowded with displays and stock, lead down to two rooms, one with a large press behind glass and a huge array of thousands of cutting tools on shelves; the other is loosely organised into sections – one area looks like an old factory office c1910, with ledgers and historic health and safety notices. Another is devoted to clothes and things that were decorated with the flowers. No space is wasted – high and low are bales of silk and other fabric, boxes of supplies and the visitor is free to handle whatever they wish that is in reach. The feeling is part stock room, part workshop, part museum.
Visitors are free to browse unaccompanied. Small capitalised typed labels are helpfully attached sporadically to explain an item or raise a question to make people look a little harder ‘how many species of leaves can you identify?’ Small cardboard mounted displays can be leafed through and contain samples, ephemera and correspondence relating to noteworthy jobs for such things as film or theatre sets. Afterwards Brenda is very approachable and invites visitors to rummage through whatever they like. She clearly enjoys answering questions about the collection. Her display approach to getting as much as possible into a small space was nicely summed up in the interview when she said: ‘I’m very good if you’re packing a car’.
What is a small museum? Or for that matter a medium or large museum? In the museum sector, size is generally measured in relation to visitor numbers, and in cases where several criteria are used, such as income or staff numbers, they are still taken into account. The Mapping Museums research team has followed suit in this respect. We decided to group the museums within our dataset into size categories that are based on visitor numbers. Thus the question for us was: how should we establish the thresholds for these categories? How many visitors equate to small, medium, and large? And should we just use those three categories? What about very tiny or really massive museums?
Arts organisations define size in slightly different ways, and in some cases, single organisations may use a variety of measures. For example, the Association of Independent Museums (AIM) uses the following categories in their ‘toolkit’:
Small = visitor numbers of up to 10,000
Medium = visitor numbers of 10,001 to 50,000
Large = visitor numbers of 50,001+
However, AIM uses slightly different bands when museums are applying for membership. In this case, the smallest category is defined as being up to 20,000, not 10,000, and there is an additional category of ‘largest museums’, which attract over 100,000 visitors. Arts Council England (ACE) data uses the same measures as the AIM toolkit, but only in relation to independent museums. When they assess the size of local authority museums, they use a different yardstick:
Band One: 30,000 visitors
Band Two 30-100,000 visitors
Band Three 100, 000+ visitors
These differences are sensitive to the realities of museum practice. By categorising museums that have less than 20,000 visitors as being small for the purposes of membership, AIM enables more organisations to pay the lower rates of subscription than if it had put the bar at 10,000 visitors. Similarly, ACE recognise that local authority and independent museums operate under different conditions. For the Mapping Museums team, however, the use of different size bands was problematic because it would be difficult to know how to categorise museums that have hybrid forms of governance, for instance, when local authorities retain ownership of museum buildings and collections but outsource its management. Using different size categories according to governance, also meant we would have to change size designations when museums changed status, and it also prevented any direct comparisons across categories of governance.
In the absence of an established rubric for museum size, we needed to decide what size bands to use in the Mapping Museums research. In order to first make that decision we looked to the data and at the overall spread of museums according to visitor numbers.
Figure 1
At this point, we had no visitor numbers for 45% of the museums in our dataset. However, when we plotted the information that was available to us (Figure 1), we could see that there was a clear peak in the data between 10,000 and 32,000 visits per year (with median about 13,000), but that there were no obvious points where the distribution of museums divided into bands. Thus the data did not suggest any clear categories for allocating size.
We then divided the distribution into quartiles, which showed that 50% of museums had between about 4,000 and 40,000 visitors per year (Figure 2).
Figure 2
One option was to create a band that covered the broad group of museums that gain between 4,000 and 40,000 visitors. The problem was that approach would elide the significant differences in scale. A museum that gains 4,000 visitors per year is likely to be run solely by volunteers or by a private individual, with limited opening, and to operate in a relatively ad-hoc fashion. A museum that attracts 40,000 visitors is reasonably well established and likely to have a professional orientation. Thus, grouping these museums did not make sense in an analytic context.
First categorisation
Our next step was to consider how various size categories would support our research. One of the problems of using three bands for sizing is that it lacks nuance. A museum that has 100,000 visitors is clearly very popular and well established but it is not in the same league as one that has visitors in the millions, yet both would normally be classified as ‘large’. Thus we initially decided to introduce more categories (see Table 1).
Size category
Yearly visitor number range
Number of museums (%)
Tiny
0-1,000
4.1
Very small
1,001-5,000
10.8
Small
5,001- 20,000
16.6
Medium
20,001 – 50,000
11.2
Large
50,001 – 100,000
5.6
Very Large
100,001 – 1million
6.1
Huge
1 million +
0.3
Unknown
–
45.3
Table 1
This approach initially seemed to work. However, when we began detailed analysis of the data the researchers found that they were constantly aggregating the three smallest categories. We did not need that degree of nuance for our work. However, we regularly used the category of ‘huge’ as a way of filtering out the very largest of institutions. Thus we decided to revert to a single category for small museums but to keep ‘huge’.
Second (and final) categorisation
Our second set of categories, which we are now using, reads: small, medium, large, and huge. Yet the question remained of where the thresholds would be set for each category. Again we turned to the data, and looked at how the distribution of museums would change if we used 10,000 or 20,000 visitors as the top limit for the category of small, and what difference it would make if 50,000 or 100,000 were used as the upper limit for ‘medium’.
Museum counts
Category thresholds
small
medium
large
huge
0; 20k; 100k; 1m
1318
677
250
13
0; 10k; 100k; 1m
930
1065
250
13
0; 10k; 50k; 1m
930
839
476
13
Table 2
As Table 2 shows, splitting small and medium at 20,000 means that the former category is significantly larger than the later. Splitting the categories at 10,000 produces a more balanced distribution between the two. In both these figures the category of large has relatively few museums because it only includes organisations with over 100,000 visitors. When that threshold is dropped to 50,000, then the size of that category almost doubles.
Importantly, the different size categorisations give a very different impression of the UK museum sector. If small museums predominate then we might assume that the sector is dominated by museums that attract few visitors, are volunteer-run museums or have few paid staff, and that possibly are struggling to survive. In contrast, if there are larger numbers of museums of a medium size, then the sector seems to be more comfortably established, and, if there are high numbers of large museums, then onlookers may conclude that it is flourishing. Thus size categorisations can have a strong impact on perceptions of the sector, even if the actual visitor numbers and lived realities of museum practice remain the same throughout.
After considerable discussion the Mapping Museums team decided to set the size categories as follows (Table 3):
Size category
Yearly visitor number range
Number of museums (%)
Small
0–10,000
22.5
Medium
10,001–50,000
20.3
Large
50,001–1 million
11.5
Huge
1 million+
0.3
Unknown
–
45.3
Table 3
For us, these categories chimed reasonably closely with norms of thinking about museum size, and are similar to those used by the AIM toolkit, which has the advantage of making them familiar within the sector. They lack nuance in the category of ‘large’, but this is not a particular issue for our research, as the focus of Mapping Museums is on smaller museums. Setting the bar at 10,000 also means that small museums do not merge into medium-sized, more established organisations, and we can examine them as a distinct group. For us, this is important because the smallest museums are often sidelined both in research and in professional discussions.
Copyright: Fiona Candlin and Andrea Ballatore, 2018
Visitor numbers provide some sense of the scale of a museum’s operations. If a museum has a large collection of priceless artefacts, occupies an impressive building, has professional curators and conservators, a nice café, and offers activities to its audiences, then it is unlikely to attract a mere 2,000 visitors per year. Conversely, if a museum is housed in a defunct railway station, with one retired locomotive on exhibition, and is staffed entirely by volunteers, then it would be surprising to discover that it gained millions of visitors. There is a link between a museum’s provision, and its visitor numbers. Thus by listing visitor numbers for the museums in our dataset, the Mapping Museums team intended to provide researchers with some guide as to the organisations’ size and character. However, this process was not as straightforward as it initially seemed.
One problem is that visitor numbers are not always available. Figures for larger institutions are reported in the national monitor Visit Britain. Information on attendance at accredited museums is published by Arts Council England, and the Museums Association usually includes visitor numbers on the Find-A-Museum service listings. Obviously, museums that are not accredited or are not members of the Museums Association do not appear on those sites. Unaccredited, unaffiliated museums may sometimes note their visitor numbers on their own website or annual report, but more often, that information cannot easily be found. Moreover, visitor numbers may not exist as such. Collecting that information requires staff capacity and resources that are beyond the reach of some organisations, and while the lack of documentation or the complete absence of data may indicate low visitor numbers, that correlation cannot be guaranteed.
Problems with visitor numbers are not confined to a lack of information. Even when visitor numbers do exist, they cannot be relied upon. One issue is that there is no accepted methodology for how visitor numbers are collected, and institutions each decide how to accomplish this task. In some instances, museums log everyone who comes through the door. However, if the museum or gallery has conveniently placed toilets, as was the case at Middlesbrough Museum of Art, then people coming to use the facilities raise the footfall. Cafes can similarly boost the total visitor count. Other museums only record the number of visitors who enter into a gallery or look at artwork, although those criteria can be met by putting artwork or displays into the foyer of a museum. It is also unclear whether people who participate in outreach or other activities are included in total numbers. We found one very small museum that reported 42,000 visitors because they organise an annual rally and included all the attendees. Who is doing the counting and how they count has a significant impact on the recorded visitor numbers.
Methodology aside, visitor numbers are sometimes actively massaged. Adrian Babbidge commented in a recent article for Cultural Trends, there are strategic reasons for inflating them and the Mapping Museums team found instances where disparate numbers had been reported. For instance, one museum stated that it had less than 20,000 visitors a year on its AIM membership forms yet claimed 30,000 visitors per year on a fund raising website. If its actual numbers were closer to 30,000 then by tweaking figures, the institution saved a little on membership fees, and if the lower number was more accurate, the upwardly adjusted figure might have improved their chances of raising money. The Mapping Museums team has also encountered cases where visitor numbers were purposefully deflated. At least one small museum had under-reported ticket sales to avoid paying tax on that income. This had the consequence of them appearing to have lower visitor numbers than is in fact the case.
Another set of difficulties obtain when dealing with historic visitor numbers. As we’ve noted before, the Mapping Museums team is documenting UK museums from 1960 until the present day. Where available we have recorded visitor numbers that pertain to that period, and most notably, we have included figures from the massive DOMUS survey that was run between 1994 and 1998. This has the advantage of providing size indicators for museums that have now closed but we have discovered that some of the DOMUS records are anomalous. For example, The Royal Electrical and Mechanical Engineers museum is listed as having the following audiences in successive years.
4,500 in 1994
20,000 in 1995
35,000 in 1996
5,000 in 1997
According to these figures, the number of visits increased eightfold in a two year period, and then reverted to its original numbers. This seemed unlikely so we contacted the museum. The director, Major Rick Henderson, told us that the museum had never attracted such high visitor numbers. Even now, with a dedicated staff and a new building, attendances are in the region of 20,000. It is therefore likely that the inflated figures are due to errors made when the data was entered into the DOMUS system. The problem is that we cannot check all the anomalies, partly because of time but mainly because many of the museums have since closed and the institutional memory lost.
Thus, there are several challenges to using visitor numbers to give a sense of the scale of a museum: it is difficult to find figures for unaccredited museums or they may never have been collected; there is no established methodology for collecting visitor numbers; museums massage audience numbers for strategic purposes; and historic records may be incorrect.
The Mapping Museums team decided to deal with these various issues by using categories for size rather than visitor numbers. Providing precise numbers may give the false impression that the figures all adhere to the same measure and can be compared, whereas categories provider a looser guide to a museums operations. Unfortunately, using size categories also has its complications, which I will outline in the next blog.
The Mapping Museums project is coming to the end of its second year. To mark the half way point of the research, this blog provides a brief update on some of the work so far.
Finalising the data
Early this year, Dr Jamie Larkin, the researcher, completed the main phase of data collection. We are continuing to make changes to the dataset as new museums open and existing museums close, and we’re still trying to hunt down some missing opening and closing dates, so it remains work in progress. Nonetheless, we now have information on almost 4,000 museums that have been open at some point between 1960 and the present day.
Evaluating the knowledge base
Alongside data gathering, we have designed a knowledge base that allows users to browse, search, and visualise the data in nuanced and precise ways, and which we described in our last blog (See: Managing Patchy Data). As part of the design process, Professor Alex Poulovassilis, the co-investigator on the project, and Nick Larsson, the Computer Science researcher and developer of the knowledge base, organised a series of trials to evaluate the knowledge base. These provided us with valuable feedback and we responded by making changes to how the material is presented and navigated.
We got enormously positive responses at the most recent user trial in Manchester in July. Having lived and breathed the research for the last two years it was very encouraging to hear Emma Chaplin, director of the Association for Independent Museums, call it the “museums equivalent to YouTube” and say that she could while away hours browsing the material; to know that staff from Arts Council England thought that it was “intuitive to use”; and generally that the trial participants assessed it as a being a useful resource for them in their roles and for others in the sector.
Analysing and publishing the findings
Having finished the data collection and the main phase of developing the knowledge base, we have been able to start analysing the data. These initial analyses will be the basis of a series of articles, and over the summer, the team has been working on four publications:
‘Mapping Museums and managing patchy data’ examines the reasons why data on the museum sector is so incoherent, how the project sought to remedy that situation, in part by building a system that acknowledges uncertain information.
‘Where was the Museum Boom?’ looks at the massive expansion of museums in the late twentieth century and asks whether or not the boom took place across the UK, or if there were regional variations.
‘Creating a Knowledge Base to research the history of UK independent museums: a Rapid Prototyping approach’, covers the computer science research that underpins the conceptualisation and construction of the knowledge base.
‘Missing Museums’ deals with the recent history of museum surveys, considers the focus on professionalised museums, and asks what the sector looks like when we factor in unaccredited museums.
Brief versions of the first and second of these papers were also presented at conferences: Digital Humanities Congress at Sheffield University and Spatial Humanities at Lancaster University, both of which took place in September, and we hope that the full versions of all four articles will be published within the next academic year. We’ll let you know when that happens.
The process of analysing data has been greatly helped by having Dr Andrea Ballatore join the team early in 2018. Andrea is a Lecturer in GIS and Big Data Analytics in the Department of Geography at Birkbeck and he is leading the statistical analysis within the project. He has also made invaluable contribution to developing the knowledge base, particularly with respect to mapping the data.
How do researchers manage when they have missing data? One of the initial aims of the Mapping Museums project was to establish an authoritative dataset of all the museums open between 1960 and 2020, and to record information on their location, governance, accreditation status, subject matter, opening and closing dates, and visitor numbers. Having this material would provide the first step in constructing a nuanced, evidence-based history of the development of the museum sector during the period, and so the research team began to compile information from numerous sources: surveys conducted by government bodies, by the Association of Independent Museums, and the Museums Association; lists of museums held by the national organisations for the arts; guidebooks; and websites. The researchers also got in touch with dozens of tourist boards and local history groups, and hundreds of curators and volunteers to follow up leads or information. All this material was cross-checked within the team, and then reviewed by experts from the Museum Development Network.
We now have a rigorously researched list of museums in the UK from 1960-2020. Even so, there is still a considerable amount of missing data. When the first phase of data collection was finished we had identified almost 4,000 museums and had established the following coverage of their key attributes:
Museum opening dates: 88%
Museum closing dates: 6%
Governance: 92%
Visitor numbers: 67%
The question then was, how were we to represent and model the missing dates, governance, and visitor numbers within our analysis?
At the same time as collecting data, we started to build a knowledge base that allows users to explore. The system is designed so that users can browse in a structured way through the categories of accreditation, governance, location, size, subject classification, year of opening and year of closing, and see the results on a map or in a list view. Alternatively, they can submit a detailed search that allows them to filter results by combinations of the categories above, or they can generate visualisations of how the different types of museums have emerged over time and create tables showing how the various categories inter-relate. At any point, it is possible to scrutinise the details of individual venues.
One option for dealing with missing information was to exclude museums with missing data from the relevant searches. The problem with that approach is that incomplete data tends to be associated with small, unaccredited museums or with museums that have since closed and so excluding them on this basis would bias our analysis in favour of extant established museums., which would be counter to the purposes of the project as a whole. Thus, when we could not identify a museum’s governance, we assigned it a value of Unknown. The advantage of an explicit Unknown category is that the missing data is made apparent, and the problem of data patchiness is exposed rather than hidden.
We took a different approach to opening and closing dates because we often had rough information about these rather than no information at all – for example, we might know that a museum had closed at some point in the 1990s. This approximate information would be lost if we just categorised a date as ‘unknown’. Therefore, we decided to use a date range of the form (earliest possible year, latest possible year) to capture imprecise knowledge about museum opening/closing dates. These date ranges are used in different ways across the different facilities provided by our system:
In the Browse facility, we take museums’ opening/closing dates to be the mid point of the specified date range.
In the Visualise facility, event occurrences are ‘spread’ equally over a date range. For example, if a museum is known to have opened between 1965 and 1969, then the count of one museum opening is spread over that time period (i.e. a count of 0.2 is assigned to each of the five years 1965, 1966, 1967, 1968, 1969).
In the Search facility, the user has the option of searching by definite dates so that the results exclude all the museums with date ranges attached, or by possible dates, in which case the results include museums where the date range intersects with the specified period. This allows for a much more nuanced analysis.
Looking in more detail at how Search works, opening and closing dates are stored as a pair of years (f,t) in our database, where f and t may be the same year if we know the year of opening/closing for certain. So, for example, the pair (1965,1969) would be stored for a museum known to have opened between 1965 and 1969; and the pair (2011,2011) would be stored for a museum known to have closed in 2011. Modal Logic operators are supported by our system’s Search facility that allow the user to query whether a particular museum definitely or possibly opened/closed in a given year. In particular, suppose a given museum ‘m’ is recorded as having opened in year ‘f’ at the earliest and year ‘t’ at the latest. Suppose a researcher wishes to find out whether museum m opened before, on, or after a specified year ‘d’. Then the following comparison operators are supported by our system to allow the researcher to determine whether this is definitely the case:
Comparison operator
Implementation logic
(f,t) = d DEFINITELY ON A SPECIFIC YEAR
f = d and t = d
(f,t) < d DEFINITELY BEFORE
t < d
(f,t) <= d DEFINITELY BEFORE OR INCLUDING
t <= d
(f,t) > d DEFINITELY AFTER
f > d
(f,t) >= d DEFINITELY AFTER OR INCLUDING
f >= d
(f,t) != d DEFINITELY APART FROM
t < d OR f > d
And the following comparison operators are supported to allow the researcher to determine whether this is possibly the case:
Comparison operator
Implementation logic
(f,t) = d POSSIBLY ON A SPECIFIC YEAR
f <= d AND d <= t
(f,t) < d POSSIBLY BEFORE
f < d
(f,t) <= d POSSIBLY BEFORE OR INCLUDING
f <= d
(f,t) > d POSSIBLY AFTER
t > d
(f,t) >= d POSSIBLY AFTER OR INCLUDING
t >= d
(f,t) != d POSSIBLY APART FROM
not (f=d and t=d)
The same comparison operators are available for interrogating closing dates.
We employed a further strategy for visitor numbers, which is the least complete category and has discontinuities that make it difficult to compare like with like. Our primary objective was to use visitor number data to provide an indication of the size of the museum and, given the patchiness of the information, we decided to have a category of Unknown and also to gross numbers into size categories of Large, Medium and Small, where large and small also have sub-categories. This approach enabled us to include data from the Association of Independent Museums and Arts Council England who generally provide visitor number ranges rather than precise figures, and to use predicative analysis to establish broad size ranges. It also allowed us to circumvent some of the methodological problems of having figures collected by different means and from across the decades. Users can browse or search according to these size categories, and in addition, they can search according to precise date-stamped visitor numbers where available.
In conclusion, in the Mapping Museums project we have managed data patchiness in a variety of ways: designing a flexible knowledge base that can be modified and added to as required; representing absence rather than ignoring unknown information; using date ranges and providing users with the option of searching by definite or possible dates; and apportioning the probability of an opening/closing event occurrence over the estimated time interval for statistical analysis. Rather than implying that all visitor numbers data are of equal reliability, we created size categories for a large number of museums, and provided the means to search the definite but incomplete data that was available.
In the process of compiling a list of all museums in the UK from 1960 until 2020, the Mapping Museums team have collected data from previous surveys and sources. As I discussed in previous blog posts, we found that surveys had excluded art galleries without collections, and to a large extent, unaccredited museums. Historic buildings are different in that their inclusion is uneven. They are listed in some circumstances, and not in others.
When the Standing Commission for Museum reviewed the sector in 1963 they included historic buildings that were managed by the Ministry of Public Buildings and Works (later English Heritage), but they only listed National Trust buildings if they contained a stand-alone museum. By contrast, when the Museums Association launched the massive Museums.UK Database in 1987, they included historic buildings and stated that the content of the building, and arguably the building itself, could be considered a collection: a venue did not need to have a stand-alone exhibition in order to qualify as a museum. The Museums Libraries Archives Council later reinforced this position when they clarified the 1998 definition of a museum by noting that ‘a collection is an organised assemblage of selected material evidence of human activity or the natural environment, accompanied by associated information. As well as objects … held within a museum building, a collection may include buildings or sites’.
From the early 1980s onwards there has been a broad consensus that historic buildings can be counted as museums. The difficulties or the unevenness around their inclusion in museum surveys and lists has two sources. The first is that historic buildings drop out of the data for the same reasons as small independent museums, which is that they do not always comply with the standards outlined by the accreditation scheme (I discussed this point in my previous post). Some of these venues might be owned or managed by major organisations including the National Trust, others and particularly stately homes, might be owned by individuals or families and thus do not meet the requirement that museums must be held in trust.
The second and more complex reason for the uneven data on historic buildings concerns the different organisations involved in their preservation, and the variety of process. Each of the four countries has a national development agency for museums, or in England, for the arts, this also having responsibility for museums. In addition, each nation has organisations that oversee the preservation of national heritage or environment or buildings: English Heritage Trust, Historic Environment Scotland, Cadw in Wales, and Historic Environment Division in Wales.
The four sister organisations have relatively similar holdings in that they look after a mixture of stately and historic homes and buildings, monuments, and sites. Crucially, however, each of these organisations takes a different approach to accreditation, which has an impact on which venues appear on lists of museums and thus on which sites are recognised as museums. In consequence, English Heritage runs thirty ‘museums’, Historic Environment Scotland seemingly operates three, while Cadw and the Historic Environment Division in Northern Ireland have only one museum apiece and in both cases that remains unofficial in that it does not appear in the records kept by that nation’s museums council. In each case, the organisational structures and histories of the departments responsible for historic buildings and environment result in different outcomes as to whether a historic building constitutes a museum.
There is no particular merit in a building being considered a museum or a heritage site. The issue is not whether something ought to be counted as a museum or a historic building. Rather it is the effect of that designation on how the museum sector is depicted. The different attribution potentially produces a skewed picture of which nations have more or less museums of a particular kind, and it potentially underplays the number of historic buildings that function as museums.
Again, this situation leaves the Mapping Museums research team with questions. Do we include those historic houses and buildings that are owned by the national bodies, although officially they are not designated as museums? Do we include those historic houses that remain in private hands? What do you think?