(Header photo: Toby’s car parked on the single track road on the way to Gairloch)
I have driven the length and breadth of Britain for Mapping
Museums to complete one of the most rewarding tasks on the project –
interviewing people who have set up independent museums. I have now recorded
more than 60 museum founders and in the process I have driven 5,870 miles to
meet them and it’s time to reflect on the trials and tribulations of life on
the road as an academic field researcher.
First there is the driving. We felt it was important to get
as wider geographical demographic spread as possible, and as many museums were
in remote locations the car was the only practical option. I visited and
photographed 40 museums, which in itself was a joy, but along the way I also got
to see some stunning parts of Britain that were new to me – redundant mills in Lancashire;
the snow swept Yorkshire Dales in December; the ruins of World War II airfields
in Lincolnshire. I kicked myself for not exploring these areas before, all just
a few hours’ drive away from my own home in Kent.
The luxury of a car also meant I could take as much equipment and luggage as I liked. For each trip I would carefully go through my packing list: laptop and digital recording equipment for interviews, notepad and paperwork, SLR camera for photographing museums inside and out, battery chargers, folding bicycle (for exercise and to give me a break from the car), a thermos flask for in-transit tea, wellies and two coats along with the usual clothes and toiletries. I also had room for a couple of bulky luxuries to make life on the road easier; firstly a four gang extension lead, with various chargers attached, perfect for charging all my equipment in rooms with few plug sockets. And finally my own feather pillow, which pretty much guaranteed me a good night’s sleep.
Between interviews life on the road was solitary, apart from
the odd hitchhiker and a few days when my path crossed with Jake, my project colleague
who was researching some of the underlying causes of museum development in
Cornwall. In the car the radio and downloaded BBC Sounds programmes were my
main companion – along with the scenery. This was most spectacular in the
Highlands of Scotland, which I criss-crossed to make meetings with founders of
croft and clan museums. Many of the small museums in the Highlands (such as Laidhay
Croft Museum and Gairloch Heritage Museum) hug the coast road, often single
track, with passing places to allow other vehicles to get by. and astonishing
views of lochs, mountains, cliffs and ancient peat bogs. The bright gorse
flowers were made even brighter by sunshine in an unseasonal heatwave (‘Auch,
it’s always like this in Scotland’, I was told several times).
Fair weather driving in the HighlandsTemporary road closure: crofters at work on Skye
Much of this work fell over the winter months, when many
smaller museums have shut their doors and the people who run them have more
time to talk. The week before Christmas I experienced the childish excitement
of a snow flurry in Pateley Bridge, a picturesque little town in the Yorkshire
Moors. I was there to interview Eileen Burgess, the 89-year old retired school
teacher and co-founder of Nidderdale Museum (a huge local history museum in
what was once the town workhouse). I stayed above a pub and after work went for
a snowy walk in the upper dale. That evening I joined the town’s Christmas fair
wandering from shop to shop to be offered mulled wine and Christmas nibbles –
so warmly welcomed that for an evening I felt like an honorary Yorkshireman.
The hardest weather was at Land’s End. I needed to get to
the Isles of Scilly and there had been a long period of gale force winds and
even supply boats hadn’t got through to the islands for a week. A morning
flight from a Cornish airfield was my only option. I stayed at the Land’s End Hotel
the night before; the hotel is on the cliffs next to the famous landmark.
Before I went to bed I ventured out and could see huge waves crashing on the
shore below. The wind howled all night. The next day I discovered that a crew
of French fisherman had been rescued from a fishing boat caught up on the rocks
below.
The next morning the wind was still gusty, but the direction was favourable for flying and I was relieved to get a call from the airport to say the flight was possible. But they warned that the unpredictable forecast meant they couldn’t guarantee the return journey and I would have to risk getting stranded on the Isles of Scilly. I had a tight interview schedule and I had driven so far; I decided to risk it.
The view from the plane, Cornish coast
After a frankly terrifying flight on the sort of small plane
that has a passenger sat next to the pilot, I had a few hours to interview Richard
Larne, author, wreck diver and founder of the Charlestown Shipwreck Centre. After
a fascinating interview in a café in St Mary’s, I got an urgent call from the
airport recommending I get the next flight before the weather turned. Richard
kindly agreed to rush me to the airport in his car for an even bumpier flight
back to the mainland (as it turned out, this was indeed the last flight for some
days). When we landed with a thump I gave a cheer, along with the five other
passengers. Now all was well and we were both very relieved; Richard had
narrowly escaped an uninvited house guest for who knows how long, and I could
make my next interview on time. And so the extraordinary journey continued –
next up would be Tony Brooks, ex-head of mining at Camborne School of Mines and
the founder of the King Edward Mine Museum. I’ll discuss the wonderful array of
project interviewees in my next post.
By Toby Butler (Research Fellow, Mapping Museums Project)
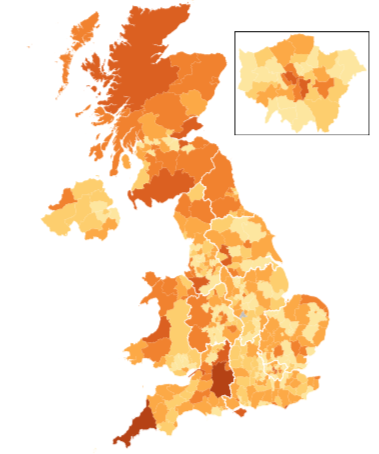
Map of museums growth UK 1960-2017 by Andrea Ballatore
Until fairly recently, I had no idea that organising museums according to their location could be quite so complicated. In the original proposal for the Mapping Museums project, we had stated that we would develop a database that would enable researchers to search our data according to a museum’s location and to visualise that information. For instance, a user could browse through all the museums in Yorkshire or see them marked as points on a map. That seemed reasonably simple. Why, then, did this task keep me awake at night?
I now know that there were three key questions and areas of research, but initially, they blurred into one confusing mass. We needed to decide which boundaries we would use, how the database would be organised with respect to location, and to identify the datasets that would underpin the database and create map-based visualisations. We also had to think about the needs of different users. This blog looks back on why we initially struggled with location and the decisions we made about how to map our data.
Choosing boundaries
The first task was deciding which boundaries we should use to search and map the museums listed in our dataset. The Museum Development Network and Arts Council use regions as the basis for organising support and funding. The Office of National Statistics also uses them in statistical analysis, and so my first thought was to follow that structure. I quickly found information on the nine regions of England and then looked for data on Northern Ireland, Scotland, and Wales, only to discover that for analytical purposes, those three countries are considered to be equivalent to regions. Putting Scotland or Wales on a par with the East of England or the West Midlands seemed to imply that these countries had the same status as a sub-section of England, and hence were insignificant in relation to England as a whole, which was problematic.
Our next approach was to organise our data according to counties. I then discovered that there are various different types of county: historic counties have their origins in the Middle Ages and still form the basis of many contemporary boundaries; ceremonial counties, which are also referred to as the geographic counties, and which are overseen by a Lord Lieutenant; and the administrative counties, which were replaced by metropolitan and shire counties. Given that we are likely to consider the allocation of financial and other resources, it seemed sensible to use the boundaries that relate to Local Authority administration, and so the Mapping Museums Computer Science researcher started to build the map according to metropolitan and shire counties. Unfortunately, when he presented his work, the image had large gaps with no information. It took me some time to work out that, even though counties are commonly referred to in each country, for administrative purposes, Wales is divided into unitary authorities, Scotland’s sub-divisions are known as council districts, and Northern Ireland has local government districts. Thus, these areas did not show up on a map that referenced counties.
The situation becomes even more complicated within England, which is divided into metropolitan and shire counties, and unitary authorities. Greater London is its own entity and does not belong to any of the other groups. Each of those categories then further sub-divides. Whereas the administrative units in Northern Ireland, Scotland, and Wales have only a single tier, England has a more complex hierarchy. Metropolitan counties divide into metropolitan districts, shire counties divide into non-metropolitan districts, and Greater London into London Boroughs. Unitary Authorities do not have sub-divisions at this level. Table 1 makes this organisation clear.
Table 1: Administrative organisation of the UK
The local authority units are differently constituted in the four countries. However, to make the situation more complicated there are different kinds of administrative geographies. Depending on the public service (census, health, postal, electoral, etc.), the territory of the UK is sliced up in different ways, as displayed in Figure 1.
Figure 1: Hierarchical representation of UK statistical geographies
For the purpose of analysis, some geographical entities like counties are widely used by British people to cognise the territory of the UK, but do not cover the entire space, leaving areas with museums unreferenced. Ideally, a useful organisation of the geographic space in this context must meet three criteria:
All territory should be covered
Units should not overlap
Units should be homogenous in terms of a target attribute (size of the resident population or something else).
UK geographies like the Output Areas or the Local Authority Districts are designed to meet these criteria and are therefore suitable for statistical analysis (less so for spatial cognition). Interestingly, the European framework NUTS aims precisely at creating some order in the messy administrative geographies of EU member states, providing a useful way to think about their commonalities and differences across countries, many of which have similarly intricate administrative geographies (while allowing interoperability and harmonisation of statistical data across different countries).
Choosing the appropriate geography for this project was therefore far from a trivial problem, and the most flexible approach consists of supporting multiple frameworks. Our solution was to identify the location of the museum as precisely as possible in terms of latitude/longitude, so that this location can then be used to assign the museum to any geographic unit., supporting different types of aggregation and analysis.
Organising ‘location’ in the database
The heterogeneous and asymmetric structure of the UK’s administrative geography also had implications for how we designed the database. We had originally intended that the search or browse facility for location would be arranged as a hierarchy of descending size or administrative importance. Following my investigations in administrative borders, I realised that there was no consistent hierarchy, and each country needed its own location logic to be defined. How then to proceed?
Throughout the research, the project co-investigator Professor Alexandra Poulovassilis has adamantly argued that we should not simplify complex data when designing the database. The search and browse functions should be able to encompass and manage some of the messiness of organisation in the real world. Accordingly, our menu of location was organised according to the separate hierarchies of the country in question. A drop-down menu shows England, Northern Ireland, Scotland, Wales, Channel Islands and Isle of Man (the latter two entities are Crown Dependencies rather than part of England). Clicking on Northern Ireland, Scotland, Wales shows their district councils, councils, or unitary authorities as appropriate. England subdivides into regions, then into a mixture of unitary authorities, counties and metropolitan counties, with the latter having the further sub-categories of districts. The region of London divides into the City of London and boroughs. Even though it is not symmetrical, this layout has the advantage of using recognisable sub-divisions, and of acknowledging the differences between the administrative geography of each country.
Identifying datasets
Having decided to use an administrative geography and having agreed that we would not attempt to simplify the differences between the four countries, we then needed to find datasets that would facilitate the organisation of our data. Once again, this involved something of a learning curve and I now know that two types of datasets are required. The first correlates administrative boundaries with postcodes (which we’d collected for each museum) and thus links each museum to a district, council area or region as required. The second dataset enables that information to be visualised in the form of a map.
Datasets that contain the coding for administrative boundaries and their visualisations are devised and available from several organisations, most notably the National Offices of Statistics. However, data collection and analysis within the UK is complicated by devolution. In some cases, the datasets cover two countries or even all four, but generally, the datasets relate to the individual countries of England, Ireland, Scotland and Wales, and to use non-computing terminology, these need stitching together.
A further issue arose in that we needed to find a way to map our data, but we also wanted to import other kinds of data to inform our findings, For instance, we planned on importing census data and using that to make links between museums and the geo-demographic contexts in which they were founded. This meant that we had to choose datasets for locations that would be compatible with any datasets that we may use in the future. In short, we needed to know if we would import additional data in the future, and if so what. It was at this point that we realised we needed expert help and were fortunate enough to have Dr Andrea Ballatore a specialist in geographic information science join the team. He advised on how the different datasets could be combined and also recommended that we use the same administrative framework as the Office of National Statistics as this would allow us to cross-reference our data. Since then the process of mapping museums has proceeded much more smoothly.
Administrative and ordinary geographies
The problem of using current administrative geographies is that they are not always in common usage. For instance, I had not previously encountered English unitary authorities and would never think to look for ‘Liverpool City Region’ when I could look for ‘Merseyside’. The database had to support analysis (i.e. link museums to the correct administrative unit in order to generate accurate statistics) and thus we had to use the relevant geographies, but it also had to support spatial cognition (i.e. help users understand where a museum is using their prior knowledge of the UK). Our solution was to introduce a TownorCity field in the search pages. Users could thereby search by administrative area or on a more intuitive basis by towns or cities.
What is a small museum? Or for that matter a medium or large museum? In the museum sector, size is generally measured in relation to visitor numbers, and in cases where several criteria are used, such as income or staff numbers, they are still taken into account. The Mapping Museums research team has followed suit in this respect. We decided to group the museums within our dataset into size categories that are based on visitor numbers. Thus the question for us was: how should we establish the thresholds for these categories? How many visitors equate to small, medium, and large? And should we just use those three categories? What about very tiny or really massive museums?
Arts organisations define size in slightly different ways, and in some cases, single organisations may use a variety of measures. For example, the Association of Independent Museums (AIM) uses the following categories in their ‘toolkit’:
Small = visitor numbers of up to 10,000
Medium = visitor numbers of 10,001 to 50,000
Large = visitor numbers of 50,001+
However, AIM uses slightly different bands when museums are applying for membership. In this case, the smallest category is defined as being up to 20,000, not 10,000, and there is an additional category of ‘largest museums’, which attract over 100,000 visitors. Arts Council England (ACE) data uses the same measures as the AIM toolkit, but only in relation to independent museums. When they assess the size of local authority museums, they use a different yardstick:
Band One: 30,000 visitors
Band Two 30-100,000 visitors
Band Three 100, 000+ visitors
These differences are sensitive to the realities of museum practice. By categorising museums that have less than 20,000 visitors as being small for the purposes of membership, AIM enables more organisations to pay the lower rates of subscription than if it had put the bar at 10,000 visitors. Similarly, ACE recognise that local authority and independent museums operate under different conditions. For the Mapping Museums team, however, the use of different size bands was problematic because it would be difficult to know how to categorise museums that have hybrid forms of governance, for instance, when local authorities retain ownership of museum buildings and collections but outsource its management. Using different size categories according to governance, also meant we would have to change size designations when museums changed status, and it also prevented any direct comparisons across categories of governance.
In the absence of an established rubric for museum size, we needed to decide what size bands to use in the Mapping Museums research. In order to first make that decision we looked to the data and at the overall spread of museums according to visitor numbers.
Figure 1
At this point, we had no visitor numbers for 45% of the museums in our dataset. However, when we plotted the information that was available to us (Figure 1), we could see that there was a clear peak in the data between 10,000 and 32,000 visits per year (with median about 13,000), but that there were no obvious points where the distribution of museums divided into bands. Thus the data did not suggest any clear categories for allocating size.
We then divided the distribution into quartiles, which showed that 50% of museums had between about 4,000 and 40,000 visitors per year (Figure 2).
Figure 2
One option was to create a band that covered the broad group of museums that gain between 4,000 and 40,000 visitors. The problem was that approach would elide the significant differences in scale. A museum that gains 4,000 visitors per year is likely to be run solely by volunteers or by a private individual, with limited opening, and to operate in a relatively ad-hoc fashion. A museum that attracts 40,000 visitors is reasonably well established and likely to have a professional orientation. Thus, grouping these museums did not make sense in an analytic context.
First categorisation
Our next step was to consider how various size categories would support our research. One of the problems of using three bands for sizing is that it lacks nuance. A museum that has 100,000 visitors is clearly very popular and well established but it is not in the same league as one that has visitors in the millions, yet both would normally be classified as ‘large’. Thus we initially decided to introduce more categories (see Table 1).
Size category
Yearly visitor number range
Number of museums (%)
Tiny
0-1,000
4.1
Very small
1,001-5,000
10.8
Small
5,001- 20,000
16.6
Medium
20,001 – 50,000
11.2
Large
50,001 – 100,000
5.6
Very Large
100,001 – 1million
6.1
Huge
1 million +
0.3
Unknown
–
45.3
Table 1
This approach initially seemed to work. However, when we began detailed analysis of the data the researchers found that they were constantly aggregating the three smallest categories. We did not need that degree of nuance for our work. However, we regularly used the category of ‘huge’ as a way of filtering out the very largest of institutions. Thus we decided to revert to a single category for small museums but to keep ‘huge’.
Second (and final) categorisation
Our second set of categories, which we are now using, reads: small, medium, large, and huge. Yet the question remained of where the thresholds would be set for each category. Again we turned to the data, and looked at how the distribution of museums would change if we used 10,000 or 20,000 visitors as the top limit for the category of small, and what difference it would make if 50,000 or 100,000 were used as the upper limit for ‘medium’.
Museum counts
Category thresholds
small
medium
large
huge
0; 20k; 100k; 1m
1318
677
250
13
0; 10k; 100k; 1m
930
1065
250
13
0; 10k; 50k; 1m
930
839
476
13
Table 2
As Table 2 shows, splitting small and medium at 20,000 means that the former category is significantly larger than the later. Splitting the categories at 10,000 produces a more balanced distribution between the two. In both these figures the category of large has relatively few museums because it only includes organisations with over 100,000 visitors. When that threshold is dropped to 50,000, then the size of that category almost doubles.
Importantly, the different size categorisations give a very different impression of the UK museum sector. If small museums predominate then we might assume that the sector is dominated by museums that attract few visitors, are volunteer-run museums or have few paid staff, and that possibly are struggling to survive. In contrast, if there are larger numbers of museums of a medium size, then the sector seems to be more comfortably established, and, if there are high numbers of large museums, then onlookers may conclude that it is flourishing. Thus size categorisations can have a strong impact on perceptions of the sector, even if the actual visitor numbers and lived realities of museum practice remain the same throughout.
After considerable discussion the Mapping Museums team decided to set the size categories as follows (Table 3):
Size category
Yearly visitor number range
Number of museums (%)
Small
0–10,000
22.5
Medium
10,001–50,000
20.3
Large
50,001–1 million
11.5
Huge
1 million+
0.3
Unknown
–
45.3
Table 3
For us, these categories chimed reasonably closely with norms of thinking about museum size, and are similar to those used by the AIM toolkit, which has the advantage of making them familiar within the sector. They lack nuance in the category of ‘large’, but this is not a particular issue for our research, as the focus of Mapping Museums is on smaller museums. Setting the bar at 10,000 also means that small museums do not merge into medium-sized, more established organisations, and we can examine them as a distinct group. For us, this is important because the smallest museums are often sidelined both in research and in professional discussions.
Copyright: Fiona Candlin and Andrea Ballatore, 2018
Visitor numbers provide some sense of the scale of a museum’s operations. If a museum has a large collection of priceless artefacts, occupies an impressive building, has professional curators and conservators, a nice café, and offers activities to its audiences, then it is unlikely to attract a mere 2,000 visitors per year. Conversely, if a museum is housed in a defunct railway station, with one retired locomotive on exhibition, and is staffed entirely by volunteers, then it would be surprising to discover that it gained millions of visitors. There is a link between a museum’s provision, and its visitor numbers. Thus by listing visitor numbers for the museums in our dataset, the Mapping Museums team intended to provide researchers with some guide as to the organisations’ size and character. However, this process was not as straightforward as it initially seemed.
One problem is that visitor numbers are not always available. Figures for larger institutions are reported in the national monitor Visit Britain. Information on attendance at accredited museums is published by Arts Council England, and the Museums Association usually includes visitor numbers on the Find-A-Museum service listings. Obviously, museums that are not accredited or are not members of the Museums Association do not appear on those sites. Unaccredited, unaffiliated museums may sometimes note their visitor numbers on their own website or annual report, but more often, that information cannot easily be found. Moreover, visitor numbers may not exist as such. Collecting that information requires staff capacity and resources that are beyond the reach of some organisations, and while the lack of documentation or the complete absence of data may indicate low visitor numbers, that correlation cannot be guaranteed.
Problems with visitor numbers are not confined to a lack of information. Even when visitor numbers do exist, they cannot be relied upon. One issue is that there is no accepted methodology for how visitor numbers are collected, and institutions each decide how to accomplish this task. In some instances, museums log everyone who comes through the door. However, if the museum or gallery has conveniently placed toilets, as was the case at Middlesbrough Museum of Art, then people coming to use the facilities raise the footfall. Cafes can similarly boost the total visitor count. Other museums only record the number of visitors who enter into a gallery or look at artwork, although those criteria can be met by putting artwork or displays into the foyer of a museum. It is also unclear whether people who participate in outreach or other activities are included in total numbers. We found one very small museum that reported 42,000 visitors because they organise an annual rally and included all the attendees. Who is doing the counting and how they count has a significant impact on the recorded visitor numbers.
Methodology aside, visitor numbers are sometimes actively massaged. Adrian Babbidge commented in a recent article for Cultural Trends, there are strategic reasons for inflating them and the Mapping Museums team found instances where disparate numbers had been reported. For instance, one museum stated that it had less than 20,000 visitors a year on its AIM membership forms yet claimed 30,000 visitors per year on a fund raising website. If its actual numbers were closer to 30,000 then by tweaking figures, the institution saved a little on membership fees, and if the lower number was more accurate, the upwardly adjusted figure might have improved their chances of raising money. The Mapping Museums team has also encountered cases where visitor numbers were purposefully deflated. At least one small museum had under-reported ticket sales to avoid paying tax on that income. This had the consequence of them appearing to have lower visitor numbers than is in fact the case.
Another set of difficulties obtain when dealing with historic visitor numbers. As we’ve noted before, the Mapping Museums team is documenting UK museums from 1960 until the present day. Where available we have recorded visitor numbers that pertain to that period, and most notably, we have included figures from the massive DOMUS survey that was run between 1994 and 1998. This has the advantage of providing size indicators for museums that have now closed but we have discovered that some of the DOMUS records are anomalous. For example, The Royal Electrical and Mechanical Engineers museum is listed as having the following audiences in successive years.
4,500 in 1994
20,000 in 1995
35,000 in 1996
5,000 in 1997
According to these figures, the number of visits increased eightfold in a two year period, and then reverted to its original numbers. This seemed unlikely so we contacted the museum. The director, Major Rick Henderson, told us that the museum had never attracted such high visitor numbers. Even now, with a dedicated staff and a new building, attendances are in the region of 20,000. It is therefore likely that the inflated figures are due to errors made when the data was entered into the DOMUS system. The problem is that we cannot check all the anomalies, partly because of time but mainly because many of the museums have since closed and the institutional memory lost.
Thus, there are several challenges to using visitor numbers to give a sense of the scale of a museum: it is difficult to find figures for unaccredited museums or they may never have been collected; there is no established methodology for collecting visitor numbers; museums massage audience numbers for strategic purposes; and historic records may be incorrect.
The Mapping Museums team decided to deal with these various issues by using categories for size rather than visitor numbers. Providing precise numbers may give the false impression that the figures all adhere to the same measure and can be compared, whereas categories provider a looser guide to a museums operations. Unfortunately, using size categories also has its complications, which I will outline in the next blog.
How do researchers manage when they have missing data? One of the initial aims of the Mapping Museums project was to establish an authoritative dataset of all the museums open between 1960 and 2020, and to record information on their location, governance, accreditation status, subject matter, opening and closing dates, and visitor numbers. Having this material would provide the first step in constructing a nuanced, evidence-based history of the development of the museum sector during the period, and so the research team began to compile information from numerous sources: surveys conducted by government bodies, by the Association of Independent Museums, and the Museums Association; lists of museums held by the national organisations for the arts; guidebooks; and websites. The researchers also got in touch with dozens of tourist boards and local history groups, and hundreds of curators and volunteers to follow up leads or information. All this material was cross-checked within the team, and then reviewed by experts from the Museum Development Network.
We now have a rigorously researched list of museums in the UK from 1960-2020. Even so, there is still a considerable amount of missing data. When the first phase of data collection was finished we had identified almost 4,000 museums and had established the following coverage of their key attributes:
Museum opening dates: 88%
Museum closing dates: 6%
Governance: 92%
Visitor numbers: 67%
The question then was, how were we to represent and model the missing dates, governance, and visitor numbers within our analysis?
At the same time as collecting data, we started to build a knowledge base that allows users to explore. The system is designed so that users can browse in a structured way through the categories of accreditation, governance, location, size, subject classification, year of opening and year of closing, and see the results on a map or in a list view. Alternatively, they can submit a detailed search that allows them to filter results by combinations of the categories above, or they can generate visualisations of how the different types of museums have emerged over time and create tables showing how the various categories inter-relate. At any point, it is possible to scrutinise the details of individual venues.
One option for dealing with missing information was to exclude museums with missing data from the relevant searches. The problem with that approach is that incomplete data tends to be associated with small, unaccredited museums or with museums that have since closed and so excluding them on this basis would bias our analysis in favour of extant established museums., which would be counter to the purposes of the project as a whole. Thus, when we could not identify a museum’s governance, we assigned it a value of Unknown. The advantage of an explicit Unknown category is that the missing data is made apparent, and the problem of data patchiness is exposed rather than hidden.
We took a different approach to opening and closing dates because we often had rough information about these rather than no information at all – for example, we might know that a museum had closed at some point in the 1990s. This approximate information would be lost if we just categorised a date as ‘unknown’. Therefore, we decided to use a date range of the form (earliest possible year, latest possible year) to capture imprecise knowledge about museum opening/closing dates. These date ranges are used in different ways across the different facilities provided by our system:
In the Browse facility, we take museums’ opening/closing dates to be the mid point of the specified date range.
In the Visualise facility, event occurrences are ‘spread’ equally over a date range. For example, if a museum is known to have opened between 1965 and 1969, then the count of one museum opening is spread over that time period (i.e. a count of 0.2 is assigned to each of the five years 1965, 1966, 1967, 1968, 1969).
In the Search facility, the user has the option of searching by definite dates so that the results exclude all the museums with date ranges attached, or by possible dates, in which case the results include museums where the date range intersects with the specified period. This allows for a much more nuanced analysis.
Looking in more detail at how Search works, opening and closing dates are stored as a pair of years (f,t) in our database, where f and t may be the same year if we know the year of opening/closing for certain. So, for example, the pair (1965,1969) would be stored for a museum known to have opened between 1965 and 1969; and the pair (2011,2011) would be stored for a museum known to have closed in 2011. Modal Logic operators are supported by our system’s Search facility that allow the user to query whether a particular museum definitely or possibly opened/closed in a given year. In particular, suppose a given museum ‘m’ is recorded as having opened in year ‘f’ at the earliest and year ‘t’ at the latest. Suppose a researcher wishes to find out whether museum m opened before, on, or after a specified year ‘d’. Then the following comparison operators are supported by our system to allow the researcher to determine whether this is definitely the case:
Comparison operator
Implementation logic
(f,t) = d DEFINITELY ON A SPECIFIC YEAR
f = d and t = d
(f,t) < d DEFINITELY BEFORE
t < d
(f,t) <= d DEFINITELY BEFORE OR INCLUDING
t <= d
(f,t) > d DEFINITELY AFTER
f > d
(f,t) >= d DEFINITELY AFTER OR INCLUDING
f >= d
(f,t) != d DEFINITELY APART FROM
t < d OR f > d
And the following comparison operators are supported to allow the researcher to determine whether this is possibly the case:
Comparison operator
Implementation logic
(f,t) = d POSSIBLY ON A SPECIFIC YEAR
f <= d AND d <= t
(f,t) < d POSSIBLY BEFORE
f < d
(f,t) <= d POSSIBLY BEFORE OR INCLUDING
f <= d
(f,t) > d POSSIBLY AFTER
t > d
(f,t) >= d POSSIBLY AFTER OR INCLUDING
t >= d
(f,t) != d POSSIBLY APART FROM
not (f=d and t=d)
The same comparison operators are available for interrogating closing dates.
We employed a further strategy for visitor numbers, which is the least complete category and has discontinuities that make it difficult to compare like with like. Our primary objective was to use visitor number data to provide an indication of the size of the museum and, given the patchiness of the information, we decided to have a category of Unknown and also to gross numbers into size categories of Large, Medium and Small, where large and small also have sub-categories. This approach enabled us to include data from the Association of Independent Museums and Arts Council England who generally provide visitor number ranges rather than precise figures, and to use predicative analysis to establish broad size ranges. It also allowed us to circumvent some of the methodological problems of having figures collected by different means and from across the decades. Users can browse or search according to these size categories, and in addition, they can search according to precise date-stamped visitor numbers where available.
In conclusion, in the Mapping Museums project we have managed data patchiness in a variety of ways: designing a flexible knowledge base that can be modified and added to as required; representing absence rather than ignoring unknown information; using date ranges and providing users with the option of searching by definite or possible dates; and apportioning the probability of an opening/closing event occurrence over the estimated time interval for statistical analysis. Rather than implying that all visitor numbers data are of equal reliability, we created size categories for a large number of museums, and provided the means to search the definite but incomplete data that was available.
In the process of compiling a list of all museums in the UK from 1960 until 2020, the Mapping Museums team have collected data from previous surveys and sources. As I discussed in previous blog posts, we found that surveys had excluded art galleries without collections, and to a large extent, unaccredited museums. Historic buildings are different in that their inclusion is uneven. They are listed in some circumstances, and not in others.
When the Standing Commission for Museum reviewed the sector in 1963 they included historic buildings that were managed by the Ministry of Public Buildings and Works (later English Heritage), but they only listed National Trust buildings if they contained a stand-alone museum. By contrast, when the Museums Association launched the massive Museums.UK Database in 1987, they included historic buildings and stated that the content of the building, and arguably the building itself, could be considered a collection: a venue did not need to have a stand-alone exhibition in order to qualify as a museum. The Museums Libraries Archives Council later reinforced this position when they clarified the 1998 definition of a museum by noting that ‘a collection is an organised assemblage of selected material evidence of human activity or the natural environment, accompanied by associated information. As well as objects … held within a museum building, a collection may include buildings or sites’.
From the early 1980s onwards there has been a broad consensus that historic buildings can be counted as museums. The difficulties or the unevenness around their inclusion in museum surveys and lists has two sources. The first is that historic buildings drop out of the data for the same reasons as small independent museums, which is that they do not always comply with the standards outlined by the accreditation scheme (I discussed this point in my previous post). Some of these venues might be owned or managed by major organisations including the National Trust, others and particularly stately homes, might be owned by individuals or families and thus do not meet the requirement that museums must be held in trust.
The second and more complex reason for the uneven data on historic buildings concerns the different organisations involved in their preservation, and the variety of process. Each of the four countries has a national development agency for museums, or in England, for the arts, this also having responsibility for museums. In addition, each nation has organisations that oversee the preservation of national heritage or environment or buildings: English Heritage Trust, Historic Environment Scotland, Cadw in Wales, and Historic Environment Division in Wales.
The four sister organisations have relatively similar holdings in that they look after a mixture of stately and historic homes and buildings, monuments, and sites. Crucially, however, each of these organisations takes a different approach to accreditation, which has an impact on which venues appear on lists of museums and thus on which sites are recognised as museums. In consequence, English Heritage runs thirty ‘museums’, Historic Environment Scotland seemingly operates three, while Cadw and the Historic Environment Division in Northern Ireland have only one museum apiece and in both cases that remains unofficial in that it does not appear in the records kept by that nation’s museums council. In each case, the organisational structures and histories of the departments responsible for historic buildings and environment result in different outcomes as to whether a historic building constitutes a museum.
There is no particular merit in a building being considered a museum or a heritage site. The issue is not whether something ought to be counted as a museum or a historic building. Rather it is the effect of that designation on how the museum sector is depicted. The different attribution potentially produces a skewed picture of which nations have more or less museums of a particular kind, and it potentially underplays the number of historic buildings that function as museums.
Again, this situation leaves the Mapping Museums research team with questions. Do we include those historic houses and buildings that are owned by the national bodies, although officially they are not designated as museums? Do we include those historic houses that remain in private hands? What do you think?
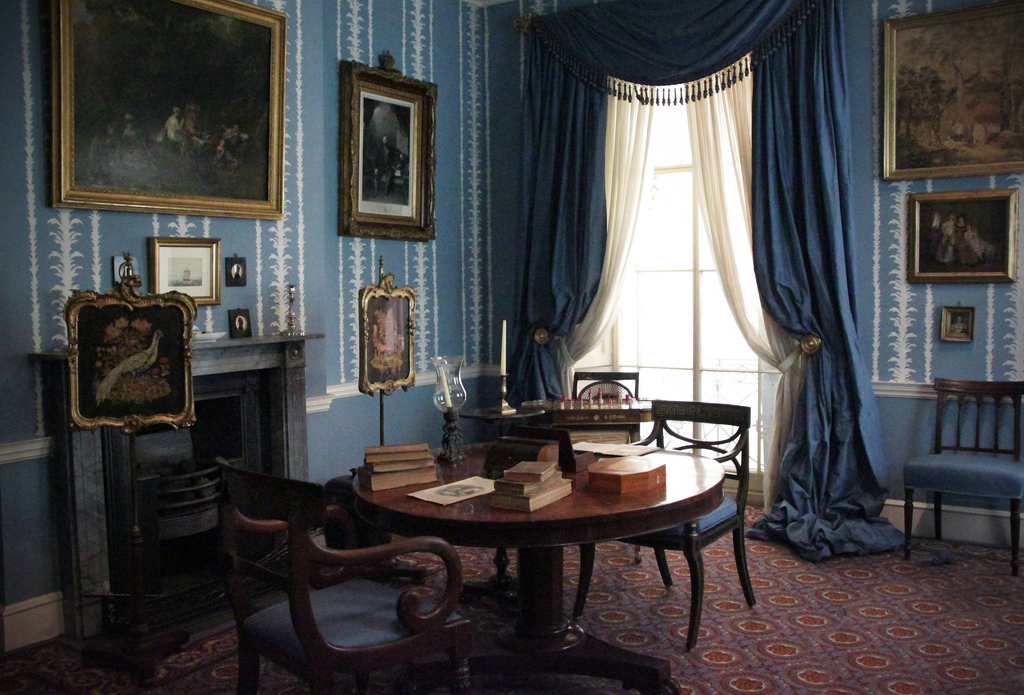
Drawing room, 1830, at the Geffrye Museum in London | Credit: KotomiCreations
Can you help us with opening and/or closing dates for the museums listed below?
The Mapping Museums research team have compiled data on around 4,000 UK museums, but we’re missing crucial information about the opening and closing dates of a few venues. We know that these venues existed, but sometimes have little more than a postcard or an old publicity flyer.
If you can help us, do please get in touch with the project director, Professor Fiona Candlin on f.candlin@bbk.ac.uk.
The museums sector generally concentrates on current practice and developments; it does not keep longitudinal data that would enable academics and museum professionals to trace patterns over time.
The result is that commentary on closure is focussed on the very recent past and lacks a broader perspective that could add insight to contemporary analyses of this phenomenon. As part of the Mapping Museums project we have built a dataset charting the development of UK museums since 1960, and we have used this to draw the first substantive picture of museum closures over time.
At the outset there are two important points to address relating to museum closure that we’ve encountered while building the dataset.
The first concerns data collection. Given the historical focus of the project, a great difficulty has been finding information regarding precise years of closure. Recent closures and closure of well-established museums are fairly well documented. The real difficulty has been tracking down information for smaller, grassroots, regional museums – particularly those that closed 15, 20, or 25 years ago.
We have conducted extensive searches via websites, historical guidebooks, and museum directories. When these were exhausted we sent emails or made telephone calls to individuals or groups, including regional museums services, local history societies or town clerks. We sent hundreds of communications in this way. Sometimes our contacts provided definitive information on when a museum closed; sometimes they could not.
For opening and closure years we have been able to generate accurate information for about 90% of museums. This has been an unprecedented undertaking and has drawn together information from a disparate range of sources. For the remaining 10% we’ve employed year ranges or made informed estimates, which we have mitigated with appropriate statistical methods in our analysis¹.
The second point is that, almost counter-intuitively, closure is difficult to define.
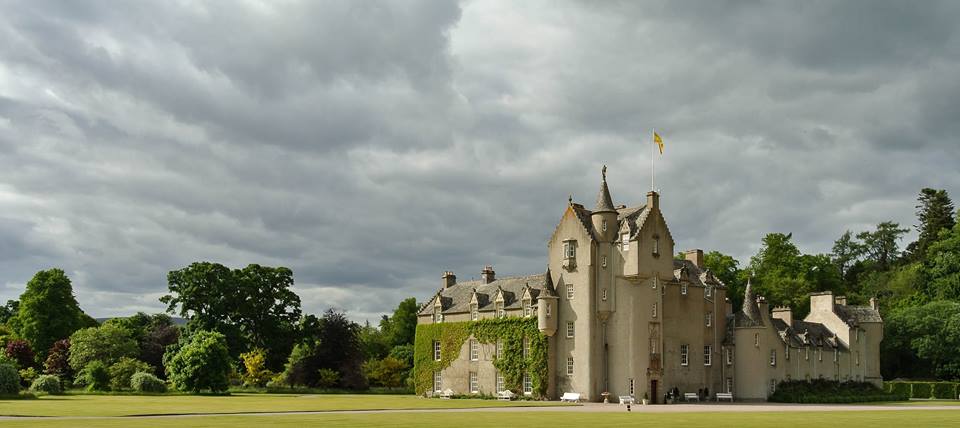
For example, if a museum ceases regular public opening hours but remains accessible in some form, should we continue to consider it open? This happened at Leith Hall House in 2009, which is now open for guided tours only. As the property is still accessible and continues to be advertised by its owner, the National Trust for Scotland, we consider it open, but this is, of course, debatable.
Furthermore, is closure is connected to premises? When a museum merges into another site, should we consider it closed or just having changed location? For example, in 2015 the Clockmakers Museum moved from its own premises into the Science Museum. Should we mark the museum closed and the collection a constituent part of the Science Museum? Its website indicates that the Clockmakers Museum retains a distinct identity. As such, we have kept it open.
The most difficult conceptual aspect to closure is that some museums don’t close per se, they gradually cease to exist. This is often the case with farm museums, where exhibitions of rural bygones are supplanted by other visitor offers (e.g. farm shop, petting zoo) so that the museum display doesn’t close with a thud at a specific moment, but gradually slips away without a whimper. In such instances we have contacted owners and discussed how best to record such forms of closure.
Generally, we have looked at closure on a case by case basis and tried to balance continuity versus change. If an effort has been made to keep a museum alive in some form we have tended to respect that, although we would log instances of material change, such as if a local authority museum was taken over by a volunteer group, etc.
Analysis
Turning to the analysis, it should be noted that these are preliminary results that will be refined prior to more formal publication, so some of the numbers presented here may be subject to slight change.
In total, we have recorded nearly 4,000 museums as being open to the public in the UK between 1960 and 2017, of which around 3,250 are currently open. This is a significant increase on the Museum Association’s estimate of 2500. Our larger number is partly due to the fact that we have a more encompassing definition of what a museum is and count unaccredited museums that may not be included in other surveys.
The figure of 3,250 open museums means that since 1960 there have been about 750 closures. This is around 20% of the total.
First let’s begin by considering the rate of closure over time.
Figure 1: Plot showing rate of museum closure in the UK by year, 1960-2017
This is a simple smoothed line plot showing the number of UK museum closures per year since 1960. There are two types of plot used in this analysis: smoothed line plot (which shows average figures and is best for perceiving general trends) and spiky line plot (which shows precise figures for specific years).
As you can see in Figure 1, peaks in closure begin around the mid 1980s (with an average 13 closures per year) with another in the late 1990s (with an average 20 closures). Following the economic crisis in 2008, the closure rate accelerates, peaking in the last few years with closures averaging 30 per year.
Figure 2: Plot showing rate of museum closure in the UK per year, 1960-2017
Figure 2 shows closure information for specific years; the highest annual number of closures we recorded was 39 museums in 2015.
A particularly significant finding from this data is that it demonstrates that around 200 museums have closed since 2010. This provided an interesting contrast to the Museum Association’s figure of ‘at least 64′ closures over the same period, cited in their Museums in the UK 2017 report.
It is clear from these graphs that closures are rising more steeply in the current period than at any point since 1960.
However, if we look at these figures in the wider context of museum opening we get a different perspective.
Figure 3: Plot showing museum openings and closings in the UK, 1960-2017
This smoothed line plot shows the annual number of UK museum openings (in green) and closures (in red) since 1960. It demonstrates that while closure rates are increasing, they are doing so in the context of a sector that until very recently has been consistently expanding.
This data substantiates the rapid expansion of museums during the 1970s and 1980s, which is often termed the ‘heritage boom’. Since the early 1990s the rate of openings has declined but they have still outpaced closures in every year except four.
Figure 4: Plot showing museum openings and closings in the UK, 1960-2017
This spiky line plot shows more clearly that for every year between 1960 and 2014 (with an exception in 2010), more museums opened than closed, meaning the sector expanded. The result is that the sector peaked in terms of total number of museums in 2014.
However, in 2015, 2016, and 2017 this trend was reversed by marginal net losses. What is particularly striking is that 2017 saw the lowest number of museum openings in the UK since 1960. This figure is 16 museums per year.
Generally speaking, this would appear to indicate a picture of robust growth over the longer term. From approximately 900 museums in 1960, the sector has seen a 260% net gain to the current situation in which numbers have begun to plateau.
However, drilling down into the data reveals some divergent trends.
For example, while the sector has grown substantially in this period, its composition has markedly changed.
Figure 5 shows number of closures by decade based on museum governance. (Note: Here we are using a simplified governance measure: ‘independent’ includes private museums or those run by trusts or foundations, while ‘state’ comprises national and local authority museums).
If we consider closure by governance, we can see that greater numbers of independent museums are closing than state run museums.
Figure 5: Museum closure by governance per decade in the UK, 1960s-2010s.
This may be expected, particularly given that smaller, private museums are often financially shaky ventures. For example, between 2010 and 2017, our data shows that over 150 independent museums closed compared to roughly 60 state run museums.
However, a more significant observation is that in proportionate terms, the closure of state run museums is higher than that of independents.
Figure 6: Plot showing percentage proportion of museum closure by governance in the UK, 1960-2017
This plot shows museum closure as a proportion of governance type.
As we can see, proportionate closure of state run museums begins to outpace closure of independents around 1995. Since 2000, the average proportionate rate of closure of state run museums has been 1.1% per year compared to around 0.7% for independents.
If we examine the data further we can see significant spikes in 2011 (when 1.8% of state run museums closed), 2015 (with 1.5%) and 2016 (with 2.4%).
When we factor in openings over this period, we also see that fewer state run museums have opened than closed since 2000. The result of this is that the state run museums sector has seen a net decline of around 14% in this period
Around 5% of this decline is accounted for by museums lost to closure while 9% is museums transferred by local authorities into trust status (which we have termed ‘hybrid’ status). We are still calibrating this aspect of our data and this figure could be higher.
In contrast, since 2000, the independent museums sector has seen a net growth of 9%.
We can see how these trends have changed the composition of the sector over the longer term.
Figure 7: Cumulative open museum by governance in the UK, 1960-2017
According to our data, in 1960 there were around 900 museums, of which 40% were state run and 50% were independent. In 2017, of the 3,250 museums we recorded, roughly 22% are state run whereas 70% are independent. As a result, we can see that the State’s direct contribution regarding the provision or management of museums is shrinking while the sector is becoming dominated numerically by independents.
Conclusions
These are some of the preliminary findings from our research.
They indicate that from 1960 onwards the museum sector expanded continually until 2010, with a slight decline in that year, but then saw further growth until it peaked in 2014. This represents 54 years of museum growth.
However, around 200 museums have closed since 2010 and for the last 3 years closures have outpaced openings. Significantly, 2017 saw the lowest rate of museum opening since 1960.
It is important, however, not to conflate the overall growth of the sector with what is happening within it. It is clear that museum growth has been principally driven by the independents and that they now ensure that the overall number of museums in the sector remains relatively static.
It is also clear that the decline in the number of state run museums – through closure or change in status – has been considerable.
This raises significant questions about the type of skills, facilities, and experiences, that are being lost with the contraction of State run museums. This issue is not just one of closure but the loss of public sector institutions.
Hopefully these initial findings provide insight into the development of the sector over the longer term and help inform the conversation about the impact of the current age of austerity on the museums sector writ large.
We will be releasing further results as we continue our analysis, so please subscribe for updates or follow us on twitter: @museumsmapping
¹ The results on which this analysis is based have been weighted to account for the uncertainty in the data. When more accurate data is not available, we use a date range for the opening and closing years of museums. For example, if we know a museum was opened between 1965 and 1975 but are unable to specify a particular year, the range of possible years (in this case 10) will be divided equally and the probability (0.1 in this case) will be added to the results for the years in the date range. This avoids over-representing individual museums, and provides a more realistic quantification than a simple count.
Patrick Cook, the founder and owner of the Bakelite Museum, started collecting plastic when he was an art student in London. Among other things, he used his collection to hold a series of Bakelite picnics, where the crowd ate food off Bakelite plates, drank tea from Bakelite cups, and listened to music played on Bakelite instruments. In 1983, Cook opened a Bakelite Museum, and in 1994 he moved the collection to its current location in the village of Williton in Somerset, opening to the public the following year. The museum is about to move again, and before it does so, we wanted to film the museum in its current incarnation.
The Mapping Museums project was motivated, in part, by the lack of documentation of small independent museums. Our research indicates that just over 2,500 independent museums have been open in the UK at some point since 1960 (This figure is higher if we include museums managed by the National Trust and other national organisations). These new independent museums focus on diverse subjects – lead mining, Methodism, local history, and Bakelite, and in doing so they make an important contribution to the cultural life of their local areas, and collectively, that of the nation. However, these small independent museums often run on a limited income, which means that they do not have the resources to document their holdings, publish catalogues of their exhibitions, or to keep an archive. Thus, if a museum moves premises, or closes, they may leave little trace behind.
The Mapping Museums project aims at documenting all the museums that have been open in the UK between 1960 and 2020. So far, the research has focused on identifying museums and on providing an overview of how the independent museum sector has emerged and developed. As our work continues, however, we will be looking at individual museums in more detail. This short film, which was made in collaboration with the Derek Jarman Lab, forms part of that enquiry.