We’ve been working on our project about museum closure for just over a year. We set out to collect information about the collections of around 500 closed museums, and our stated ambition was to cover at least 70% of them. Some of our team had prior experience of researching closed museums and knew that details were often hard to come by, so that target seemed realistic. A year on, we’ve done much better than expected. Of our initial list we have found information on over 90%.
What remains is a list of what we’re calling the stuck museums. In these cases we think we’ve exhausted our avenues of enquiry, and still don’t have information on what happened to the collections.
What have we tried? An incomplete list: Googling; meeting members of the Museums Development Network; contacting local history societies, who often had leads but sometimes knew no more than we did; asking nearby museums; consulting local authority planning documents that indicate the change of use of premises; examining auction catalogues; searching newspaper archives; for one case visiting the National Archives and for another two, the archives of British Telecom; searching social media; picking the brains of the Arts Council’s Accreditation team; using the Wayback Machine; when no contact details existed bar a postal address for directors of the small company that ran the museum, writing letters – an unusual activity in 2024; making Freedom of Information requests to local authorities when informal enquiries went unanswered; joining specialist groups on Facebook for collectors of paperweights, Matchbox cars, and antique dolls, to name just three.
That’s not all. We’ve also tried: asking members of the Subject Specialist networks; emailing the foremost writer in English on the work of a Japanese novelist; contacting organisations that used to run the museums or who now occupy the site; having obtained snippets of information, more precisely targeted Googling; interviewing specialists in regimental and transport museums; emailing local politicians, drinks manufacturers, race courses; attempting to contact a retired magician; using a website that lists the destinations of former military aircraft; seeking help from the unofficial historian of a major football club; interviewing the biographer of a man who ran two shipwreck museums; asking local libraries; reading council reports and collection development policies; asking the police (about police museums); meeting an expert on recent local authority museum closures; emailing hospitals; writing to the BBC; asking former curators, a local board of education, the National Trust, auction houses; interviewing outgoing curators.
This may sound exhaustive (and exhausting). We’ve been as thorough as we can, yet for some museums we remain stuck, with little or no information on what happened to the museums or their collections.
Can you help us with any of them? We’re looking for information on why the museums closed, what happened to their collections, and what their buildings are now used for, if they still exist.
Collecting information on closed museums is a challenge. Museums usually open with a degree of fanfare but often close quietly – and their catalogues, visitor books, and other documentation are not always retained. (Although cowhide hats off to Northampton Museum and Art Gallery for keeping the data from the now-closed Museum of Leathercraft). No-one is specifically charged with keeping records from closed museums and it is hard to find anyone connected to a closed museum, especially after twenty years or more. The staff have relocated, volunteers filter off to other organisations or spend their time in other ways, people die. In this blog I’m going to outline some of the ways that we were able to collect information.
We began by scouring the internet. In some cases, websites or social media accounts lived on after the museum had closed and occasionally the final post explained the circumstances of closure and what was happening to the collections. These pages also provided contact details. Most of the time our emails bounced, and the phone numbers we called were defunct or had been reallocated to someone new, who would be utterly bemused by our enquiries, but in some cases, especially at private museums, the museum owner still lived or worked on the premises. When I called the number for Red Carriage Working Museum in Matlock, Derbyshire, the proprietor told me a moving story about being forced to close when professional burglars stole their entire collection of antique and irreplaceable harnesses, thereby making it impossible for them to show the carriages in action. Although she and her husband sold the yard and the rest of their substantial collection, they had kept the house.
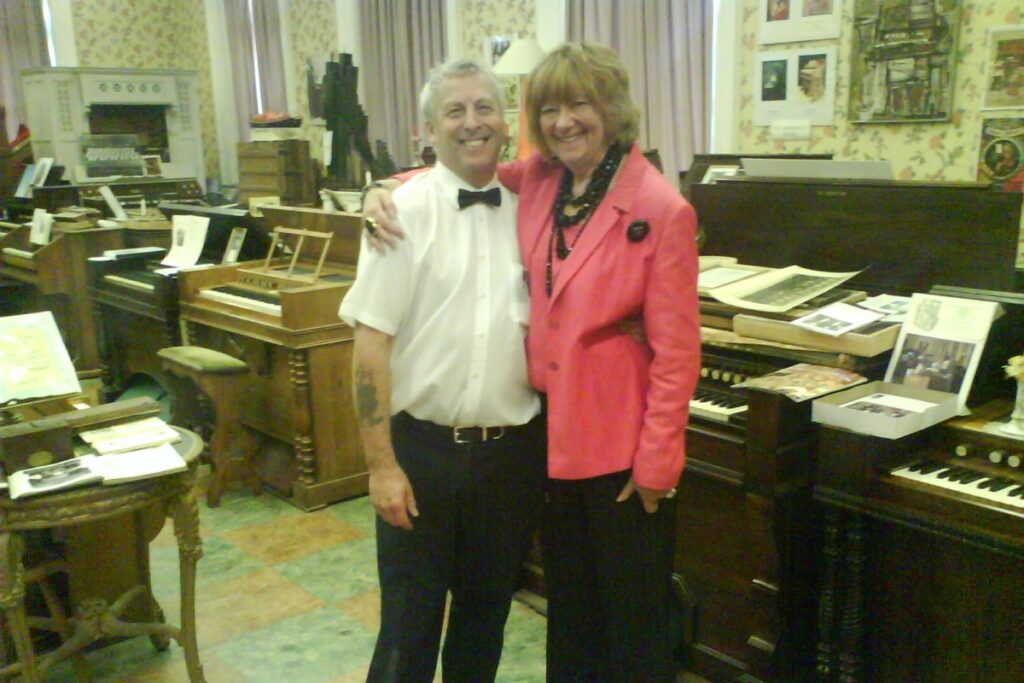
In other cases, online reviews, blogs, or chat forums gave us a lead. A TripAdvisor review for the Longstone café on the Isles of Scilly, noted that it had replaced the Longstone Heritage Centre. Amy Jenkins the proprietor told me that all kinds of things had been left at the site – including two cannonballs which she gave to her father – and gave me the name of the founder who I was then able to contact. Similarly, an online chat forum mentioned that the founders of Harmonium Museum in Shipley, Yorkshire, Phil and Pam Fluke, were continuing to repair instruments. A few clicks later, I found their website and was able to get in touch. Phil also gave me some leads for other closed museums. Alternatively, we called the business at the location where a museum used to be. Jacob Clark, owner of the Animal Avenue Pet Supplies shop at Ringwood, told me that the shop fronts from the Ringwood Town and Country Experience were still outside and a collection of objects in the attic. And we put out calls for help on social media. Twitter users provided an obituary for Kathleen Mann who had run a Cat Museum at her antiques shop in Harrow-on-the-Hill in London, which enabled us to pinpoint the date of closure.
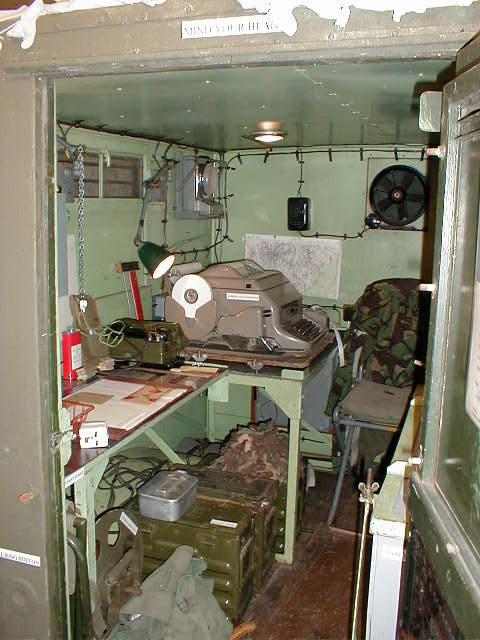
Sometimes we spent a lot of time investigating one museum to no immediate avail. Finding pictures of the Museum of Cipher Equipment in Cupar on a cipher enthusiasts’ website, I contacted the webmaster in California who emailed a call for information to his network. We also contacted staff at Scotland’s Secret Nuclear Bunker, the Museum of Cupar, and the Museum of Communications, none of whom had heard of the museum but promised to investigate further. I posted on Twitter and word spread. A historian raised it at a museums meeting in nearby Dundee and a member of Museum Association staff persuaded their in-laws who lived in the area to make enquiries on our behalf. Some months later I got an email from the owner. He had visited the Secret Nuclear Bunker and they had passed my email on to him. It turned out that the collection had been destroyed in a fire and that he had moved to Orkney.
Another alternative, especially when we were investigating Local Authority museums, was to contact a neighbouring institution. The staff were often only too aware of closures in the area and in many cases had either inherited the collection or been personally involved in its relocation. Out-of-the-blue telephone calls or emails regularly elicited extremely helpful responses along the lines of ‘The objects all came back into the service. It was before my time, but I can put you in touch with my predecessor if you want more detail. I have his email’ (Wirral Museums Service) or ‘The Lace Museum was never part of the Nottingham Service, although a lot of people thought it was. Some of the collection did come to us. I can send you the relevant section of the catalogue if that’s of interest to you’ (Andrew King, Registrar). Needless to say, it was.
Alongside our internet searches we contacted area museum services or the members of staff with responsibility for heritage in local councils. They were often extremely helpful, giving detailed information about why a museum had closed and where the collections had gone. We also met with the Museums Development Network who scanned through lists of closed museums in their regions, trying to dredge up memories of long-gone venues, as did subject specialists. Anthony Coulls, Senior Curator at the National Railway Museum in York, got in touch when he read about the research and checked our information on closed transport museums while Julian Farrance, Regimental Officer at the National Army Museum and Paul Evans, ex-Historical Projects Officer at the Army Museums Ogilby Trust, looked over our lists of closed military museums.
All of the input that we have received has been very useful: thank you to everyone who has given us information, leads, or advice. We really couldn’t do this without you. However, we’re still trying down missing information on some museums so do keep watch on this space for updates and, no doubt, calls for help.
The Mapping Museums Lab have been collecting data on over 450 closed museums, including what happens to their collections and buildings. As we gather information about collections, we’re learning that the data available varies widely from one museum to another. In some cases we’ve obtained a list of where every exhibit went, with the type of destination (such as a museum or private storage facility), and sometimes the state of repair of individual objects. In other cases, we have gathered little more than that the collection was sold, often at auction, and dispersed into private hands.
We’re in the relatively early stages of a two-year project, but some patterns are already starting to emerge. For instance, legal processes can have the effect of producing better public documentation for collection dispersals. Liquidators managing company insolvencies produce annual reports, which detail the disposal of assets, and a set of those reports were produced when the parent charity of the Yorkshire Waterways Museum went into liquidation. A more controversial example is the British Empire and Commonwealth Museum, where accusations of impropriety led to numerous news reports that documented the complex trajectories of some of the exhibits. Although Bristol Museums now look after the bulk of the collection, the whereabouts of some items formerly held by the BECM are still unknown.
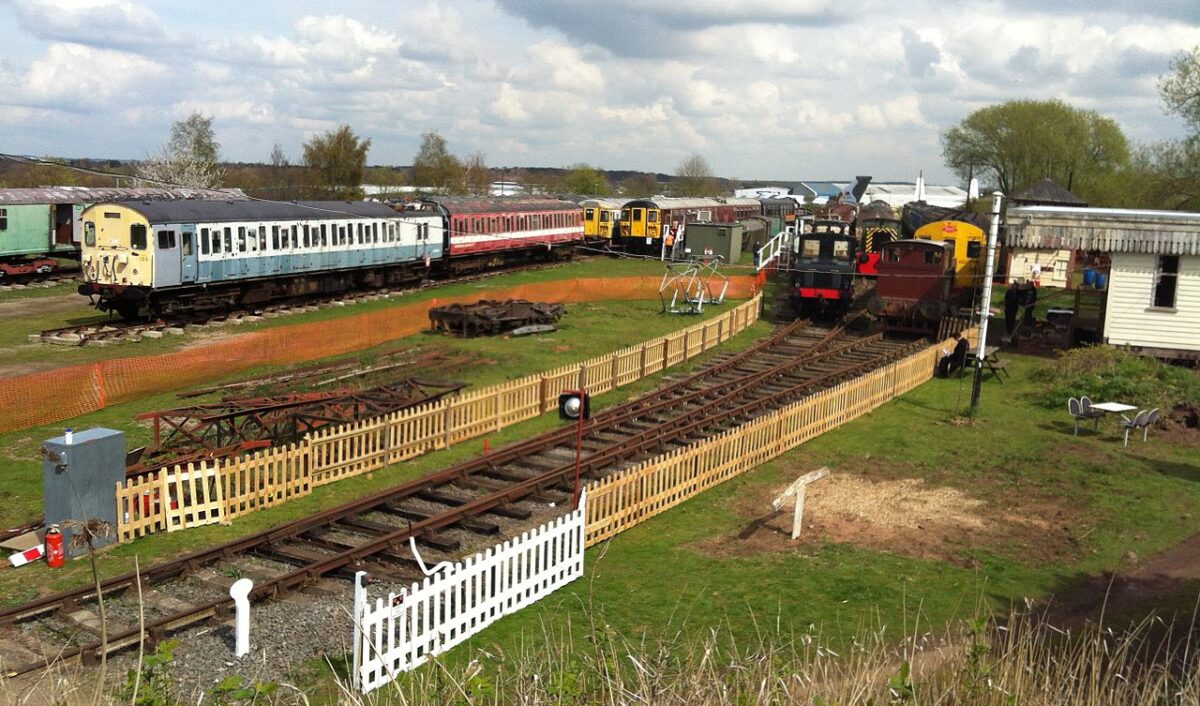
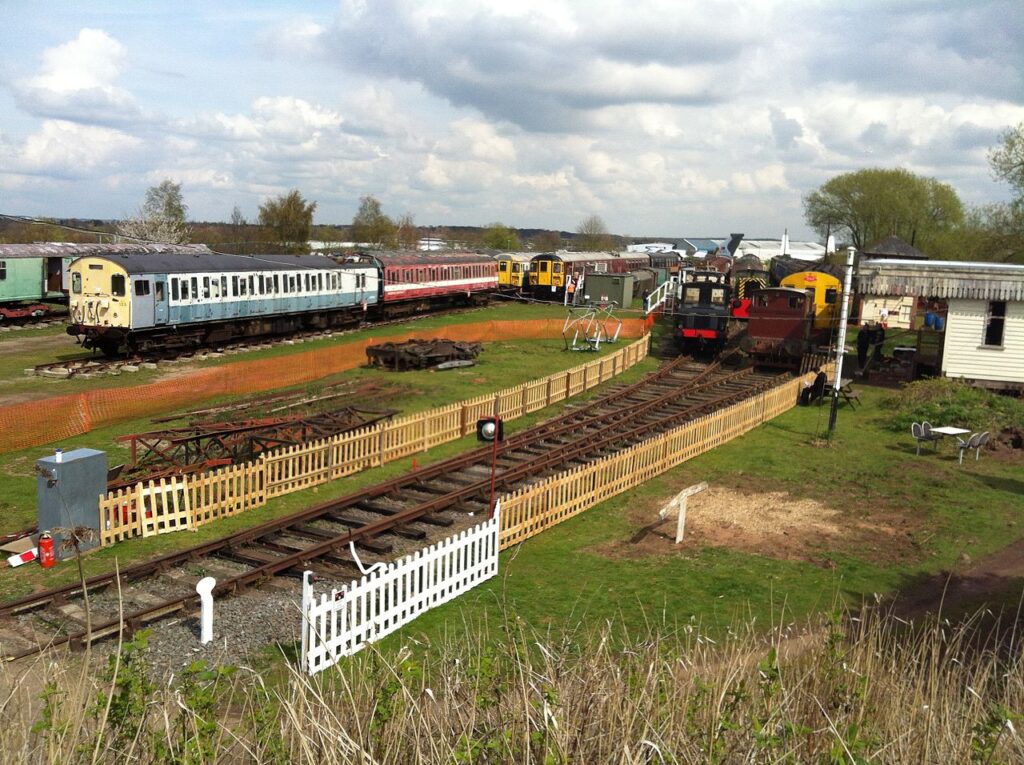
The type of object displayed can make a big difference to the amount of information available. Museums of aviation and railways, which in the cases we’re looking at often display a fairly small number of large objects, are particularly well documented. One example is the Electric Railway Museum, which was a collection of locomotives, electric multiple units and related items, sited near Coventry. The museum’s founder kindly supplied us with a detailed list of the whereabouts of the collection, and the ownership status of each object.
The collections of closed aviation museums can also be fairly straightforward to track. Each plane, in addition to having a manufacturer and model, also has a unique identification number that enables its whereabouts to be found. I have never needed to visit the Demobbed website before starting this project, but that database of former military aircraft has proved invaluable in tracking down some of the planes that were held by now-closed museums. Demobbed features extensive lists of aircraft locations maintained by the Wolverhampton Aviation Group, who are evidently a dedicated community of enthusiasts. Each plane’s history is detailed, including whether parts of it, such as nose cones, were removed and dispersed.
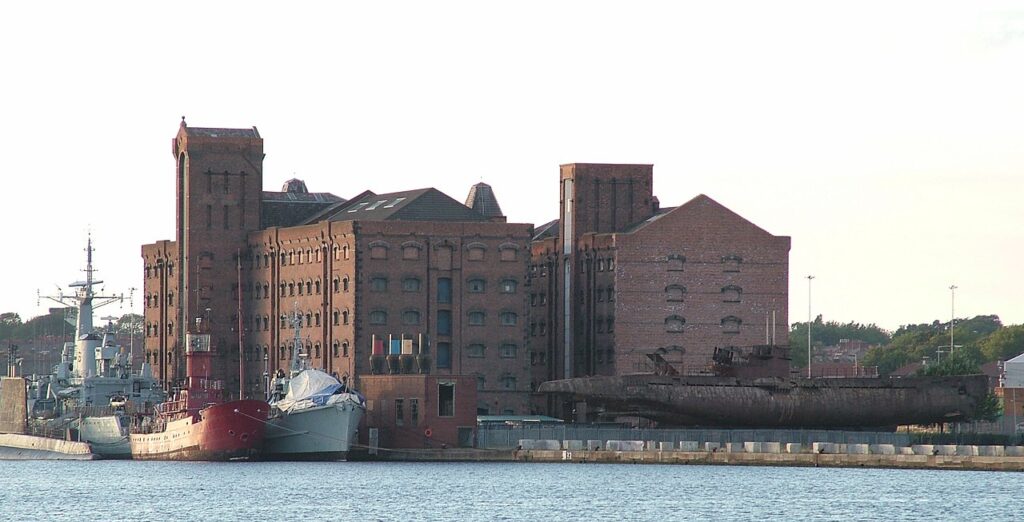
Museums featuring ships and boats have also been relatively easy to track. The small collection of five ships and submarines once held by the Warship Preservation Trust in Birkenhead has been exhaustively documented. This is partly due to a museum and a heritage organisation acquiring two of the vessels. But thanks to enthusiasts keeping an eye on the others, documenting them online and sometimes campaigning for their preservation, we know that a submarine and the frigate HMS Plymouth were scrapped, while the last known destination of the minesweeper HMS Bronington was a dock in Birkenhead, where it had partially sunk at its moorings.
But for another maritime collection there is more uncertainty about destinations. The large collection of boats at the Eyemouth Maritime Centre was sold at auction in 2017. The sale attracted a fair amount of attention from boating enthusiasts, which means that we have been able to track the destinations of quite a few of the boats. However, around 100 boats were reportedly purchased by a collector and cut up to enable transportation to China. This shipment was apparently intended for a new maritime museum but we don’t know whether it ever opened, leaving the whereabouts of a substantial part of the Eyemouth collection unknown.
Although planes, trains, and ships have been easy enough to track down in many cases, car and motorcycle museums are another matter. So far, we’ve found that many of these collections go to auction and are subsequently dispersed to private buyers. Occasionally it’s possible to discover that some items have gone to museums, but not always which ones. The auctioneers of the London Motorcycle Museum told us that three of the bikes had been purchased by museums, but our enquiries have not revealed precisely where they went. The case of the Cars of the Stars museum, mentioned in a previous blog, where the collection went to just one buyer who also runs a museum, appears to be quite unusual. As the destinations of auctioned items are rarely reported, that type of museum dispersal is often the end of the trail for us.
As our research continues, it’s becoming apparent that although some collections are very well documented, sometimes down to the level of individual items, in many cases we are simply recording groups of items as moving from a closed museum. And it’s unfortunately quite likely that we will never know what has happened to many others, with the destinations of items and even whole collections left unrecorded. Those differences in what we can find out have implications for how we analyse our data. We don’t want to over-represent some collections in our analyses simply because we have more details about them, or under-represent others that are less well documented. As a team we’re continuing to discuss how best to grapple with that problem.
What does the Mapping Museums research assistant do all day?
I sometimes wonder where all the time goes. Although the vast majority of the four
thousand-odd museums listed in the database were added before I really began
work on the project, I’ve added well over a hundred new museums and made
corrections to the entries for hundreds more. But how do we find out about
museums that were not already in the database, and where do all the amendments
come from? Here I offer a peek into a ‘typical’ week.
Monday
A friend of the project reports on Twitter a possible new
museum she’s spotted while on a bike ride. It turns out that it is not new, but
the small private museum has slipped under the Mapping Museums radar, so I add
it to the database. Another contact has suggested we check a directory of
railway preservation sites to make sure we haven’t missed any railway museums
during our searches. I order it from the British Library for my next visit.
Tuesday
I have Google news alerts set up in the hope of spotting
museums closing and opening, and I open my email this morning to find an alert
for a new museum. All too often these alerts don’t produce anything useful, but
on this occasion they have. A new private museum dedicated to the footballer Duncan
Edwards has opened above a shop in Dudley, in the West Midlands, so I make
a note to add it to the database.
The Mapping Museums database is constantly being updated.
When we receive new information for museums currently open, we update our
records accordingly. Today I find that a curator has supplied updated details
for their museum using the form for editing data, and
process the update so that the details are added to the database.
Wednesday
At the British Library for my own PhD research, I also look
at the railway preservation directory. At first sight it looks somewhat
daunting, as it lists hundreds of railway preservation sites in Britain opened
from the 1950s onwards, classified into thirteen types. Each one of these will
potentially need to be checked against the database to see whether museums need
to be added. I copy the pages I need for processing later.
Looking through copies of Museums Journal I see
mention of another museum that I’m not familiar with. It’s in the database, but
the news item gives extra information about the museum’s governance that we
didn’t have, so I make a note for later.
Sometimes we need to contact museums directly to confirm
information, and recently I have been trying to get hold of the administrator of
a small military museum in Scotland (the museum came to our attention as part
of a list supplied by a liaison officer for regimental museums). The
administrator is only on site occasionally, and so far I have missed him each
time I’ve called. I miss a call while sitting in the library’s reading room,
and when I return it later I have just missed him, but his colleague supplies
his email address. By email he confirms the nature of the collection, but does
not know when the museum was first opened – he has been in the post for less
than two years. One thing I’ve discovered doing this research is that it is
quite common for the opening date of museum not to be known by those who run
it. A museum’s foundation date is often tacit knowledge, which can easily be
lost as staff change. The database currently contains almost five hundred
museums for which we do not have a certain opening date, and we record them as
date ranges instead based on the best information available.
Thursday
I resume work on a list of museums that another contact has
provided us with. They are all in North East England. Not all of them qualify
as museums in the way that the project defines them but many do, and for
whatever reason some have been overlooked. Small private museums are easily
missed, and it would not be possible for the project to have compiled as
comprehensive a list as it has without the benefit of local knowledge. One
example is the Ferryman’s
Hut Museum in Alnmouth, which I add to the database.
Friday
The opening date of a museum is proving elusive. My enquiry
to the owners remains unanswered, so I resume searching online. Eventually I
track it down in the Gloucestershire volumes of the Victoria
County History, an incredibly valuable local history resource.
It’s fortunate that that museum was recorded, but what do
you do when a museum has long closed and there are no references to be found
online, no matter how hard you search? Well, you might descend the archive.org rabbit hole. As anyone who has
followed references in Wikipedia may have noticed, website links stop working all
the time – a phenomenon colloquially known as ‘link rot’. The Wayback Machine preserves websites for
posterity, keeping copies of those still online as well as many that have long
since vanished. In this case we knew that the museum had closed thanks to an
estate agent’s website, but when did it open? The website for the tower in the
Scottish Borders had fortunately been captured by the wayback machine, and
while there was no definitive information about the museum, there was enough to
allow a range of dates for the museum’s opening to be recorded.
It’s the end of another week of data collection and checking. That list of hundreds of railway preservation sites will have to wait until another time …
Since our blog entry on building the database, we have held a series of user trials of the Mapping Museums database and the Web Application through which the database is accessed. These trials have given us much useful feedback for improving the system as well as a positive endorsement of the overall development approach. For example, museums experts told us that the system is “useful to anyone wanting to understand the museum sector as this is the closest we’ve ever been to getting a full picture of it”, “intuitive to use”, “the Museum equivalent of YouTube”.
The figure on the left shows the architecture of our system. It has a three-tier architecture comprising a Web Browser-based client served by a Web Server connecting to a Database Server. The database is implemented as a triple store, using Virtuoso, and it supports a SPARQL endpoint for communicating with the Web Server. The system currently comprises some 28,600 lines of Python code, as well as additional scripts consisting of 25,800 lines of JavaScript, HTML pages, and other source files.
Usage of the database and Web Application by the project’s researchers has already led to insights about periods and regions that show high numbers of museum openings or closings, changes in museums’ accreditation and governance status over the past 60 years, and popular subject areas. There will be two more years of detailed research, both qualitative and quantitative, building on this first phase of research.
The qualitative research is comprising both archival and interview-based work. The quantitative research is investigating correlations between high rates of openings or closings of museums and attributes such as accreditation, governance, location, size, and subject matter. The new attributes Geodemographic Group/Subgroup and Deprivation Index are enabling new analyses into the demographic context of museums’ openings/closing, including cross-correlation of these aspects with the other museum attributes, and hence the charting of new geographies of museums.
Ongoing development work is extending the Web Application into a full Website to showcase the outcomes and findings of the project. We are also developing a new web service to allow the capture of data updates relating to existing museums and the insertion of data about new museums. There will be forms allowing the public upload of such data which will be subsequently validated by the project’s domain experts before being inserted into the database.
What is a small museum? Or for that matter a medium or large museum? In the museum sector, size is generally measured in relation to visitor numbers, and in cases where several criteria are used, such as income or staff numbers, they are still taken into account. The Mapping Museums research team has followed suit in this respect. We decided to group the museums within our dataset into size categories that are based on visitor numbers. Thus the question for us was: how should we establish the thresholds for these categories? How many visitors equate to small, medium, and large? And should we just use those three categories? What about very tiny or really massive museums?
Arts organisations define size in slightly different ways, and in some cases, single organisations may use a variety of measures. For example, the Association of Independent Museums (AIM) uses the following categories in their ‘toolkit’:
Small = visitor numbers of up to 10,000
Medium = visitor numbers of 10,001 to 50,000
Large = visitor numbers of 50,001+
However, AIM uses slightly different bands when museums are applying for membership. In this case, the smallest category is defined as being up to 20,000, not 10,000, and there is an additional category of ‘largest museums’, which attract over 100,000 visitors. Arts Council England (ACE) data uses the same measures as the AIM toolkit, but only in relation to independent museums. When they assess the size of local authority museums, they use a different yardstick:
Band One: 30,000 visitors
Band Two 30-100,000 visitors
Band Three 100, 000+ visitors
These differences are sensitive to the realities of museum practice. By categorising museums that have less than 20,000 visitors as being small for the purposes of membership, AIM enables more organisations to pay the lower rates of subscription than if it had put the bar at 10,000 visitors. Similarly, ACE recognise that local authority and independent museums operate under different conditions. For the Mapping Museums team, however, the use of different size bands was problematic because it would be difficult to know how to categorise museums that have hybrid forms of governance, for instance, when local authorities retain ownership of museum buildings and collections but outsource its management. Using different size categories according to governance, also meant we would have to change size designations when museums changed status, and it also prevented any direct comparisons across categories of governance.
In the absence of an established rubric for museum size, we needed to decide what size bands to use in the Mapping Museums research. In order to first make that decision we looked to the data and at the overall spread of museums according to visitor numbers.
At this point, we had no visitor numbers for 45% of the museums in our dataset. However, when we plotted the information that was available to us (Figure 1), we could see that there was a clear peak in the data between 10,000 and 32,000 visits per year (with median about 13,000), but that there were no obvious points where the distribution of museums divided into bands. Thus the data did not suggest any clear categories for allocating size.
We then divided the distribution into quartiles, which showed that 50% of museums had between about 4,000 and 40,000 visitors per year (Figure 2).
One option was to create a band that covered the broad group of museums that gain between 4,000 and 40,000 visitors. The problem was that approach would elide the significant differences in scale. A museum that gains 4,000 visitors per year is likely to be run solely by volunteers or by a private individual, with limited opening, and to operate in a relatively ad-hoc fashion. A museum that attracts 40,000 visitors is reasonably well established and likely to have a professional orientation. Thus, grouping these museums did not make sense in an analytic context.
First categorisation
Our next step was to consider how various size categories would support our research. One of the problems of using three bands for sizing is that it lacks nuance. A museum that has 100,000 visitors is clearly very popular and well established but it is not in the same league as one that has visitors in the millions, yet both would normally be classified as ‘large’. Thus we initially decided to introduce more categories (see Table 1).
Size category
Yearly visitor number range
Number of museums (%)
Tiny
0-1,000
4.1
Very small
1,001-5,000
10.8
Small
5,001- 20,000
16.6
Medium
20,001 – 50,000
11.2
Large
50,001 – 100,000
5.6
Very Large
100,001 – 1million
6.1
Huge
1 million +
0.3
Unknown
–
45.3
Table 1
This approach initially seemed to work. However, when we began detailed analysis of the data the researchers found that they were constantly aggregating the three smallest categories. We did not need that degree of nuance for our work. However, we regularly used the category of ‘huge’ as a way of filtering out the very largest of institutions. Thus we decided to revert to a single category for small museums but to keep ‘huge’.
Second (and final) categorisation
Our second set of categories, which we are now using, reads: small, medium, large, and huge. Yet the question remained of where the thresholds would be set for each category. Again we turned to the data, and looked at how the distribution of museums would change if we used 10,000 or 20,000 visitors as the top limit for the category of small, and what difference it would make if 50,000 or 100,000 were used as the upper limit for ‘medium’.
Museum counts
Category thresholds
small
medium
large
huge
0; 20k; 100k; 1m
1318
677
250
13
0; 10k; 100k; 1m
930
1065
250
13
0; 10k; 50k; 1m
930
839
476
13
Table 2
As Table 2 shows, splitting small and medium at 20,000 means that the former category is significantly larger than the later. Splitting the categories at 10,000 produces a more balanced distribution between the two. In both these figures the category of large has relatively few museums because it only includes organisations with over 100,000 visitors. When that threshold is dropped to 50,000, then the size of that category almost doubles.
Importantly, the different size categorisations give a very different impression of the UK museum sector. If small museums predominate then we might assume that the sector is dominated by museums that attract few visitors, are volunteer-run museums or have few paid staff, and that possibly are struggling to survive. In contrast, if there are larger numbers of museums of a medium size, then the sector seems to be more comfortably established, and, if there are high numbers of large museums, then onlookers may conclude that it is flourishing. Thus size categorisations can have a strong impact on perceptions of the sector, even if the actual visitor numbers and lived realities of museum practice remain the same throughout.
After considerable discussion the Mapping Museums team decided to set the size categories as follows (Table 3):
Size category
Yearly visitor number range
Number of museums (%)
Small
0–10,000
22.5
Medium
10,001–50,000
20.3
Large
50,001–1 million
11.5
Huge
1 million+
0.3
Unknown
–
45.3
Table 3
For us, these categories chimed reasonably closely with norms of thinking about museum size, and are similar to those used by the AIM toolkit, which has the advantage of making them familiar within the sector. They lack nuance in the category of ‘large’, but this is not a particular issue for our research, as the focus of Mapping Museums is on smaller museums. Setting the bar at 10,000 also means that small museums do not merge into medium-sized, more established organisations, and we can examine them as a distinct group. For us, this is important because the smallest museums are often sidelined both in research and in professional discussions.
Copyright: Fiona Candlin and Andrea Ballatore, 2018
Visitor numbers provide some sense of the scale of a museum’s operations. If a museum has a large collection of priceless artefacts, occupies an impressive building, has professional curators and conservators, a nice café, and offers activities to its audiences, then it is unlikely to attract a mere 2,000 visitors per year. Conversely, if a museum is housed in a defunct railway station, with one retired locomotive on exhibition, and is staffed entirely by volunteers, then it would be surprising to discover that it gained millions of visitors. There is a link between a museum’s provision, and its visitor numbers. Thus by listing visitor numbers for the museums in our dataset, the Mapping Museums team intended to provide researchers with some guide as to the organisations’ size and character. However, this process was not as straightforward as it initially seemed.
One problem is that visitor numbers are not always available. Figures for larger institutions are reported in the national monitor Visit Britain. Information on attendance at accredited museums is published by Arts Council England, and the Museums Association usually includes visitor numbers on the Find-A-Museum service listings. Obviously, museums that are not accredited or are not members of the Museums Association do not appear on those sites. Unaccredited, unaffiliated museums may sometimes note their visitor numbers on their own website or annual report, but more often, that information cannot easily be found. Moreover, visitor numbers may not exist as such. Collecting that information requires staff capacity and resources that are beyond the reach of some organisations, and while the lack of documentation or the complete absence of data may indicate low visitor numbers, that correlation cannot be guaranteed.
Problems with visitor numbers are not confined to a lack of information. Even when visitor numbers do exist, they cannot be relied upon. One issue is that there is no accepted methodology for how visitor numbers are collected, and institutions each decide how to accomplish this task. In some instances, museums log everyone who comes through the door. However, if the museum or gallery has conveniently placed toilets, as was the case at Middlesbrough Museum of Art, then people coming to use the facilities raise the footfall. Cafes can similarly boost the total visitor count. Other museums only record the number of visitors who enter into a gallery or look at artwork, although those criteria can be met by putting artwork or displays into the foyer of a museum. It is also unclear whether people who participate in outreach or other activities are included in total numbers. We found one very small museum that reported 42,000 visitors because they organise an annual rally and included all the attendees. Who is doing the counting and how they count has a significant impact on the recorded visitor numbers.
Methodology aside, visitor numbers are sometimes actively massaged. Adrian Babbidge commented in a recent article for Cultural Trends, there are strategic reasons for inflating them and the Mapping Museums team found instances where disparate numbers had been reported. For instance, one museum stated that it had less than 20,000 visitors a year on its AIM membership forms yet claimed 30,000 visitors per year on a fund raising website. If its actual numbers were closer to 30,000 then by tweaking figures, the institution saved a little on membership fees, and if the lower number was more accurate, the upwardly adjusted figure might have improved their chances of raising money. The Mapping Museums team has also encountered cases where visitor numbers were purposefully deflated. At least one small museum had under-reported ticket sales to avoid paying tax on that income. This had the consequence of them appearing to have lower visitor numbers than is in fact the case.
Another set of difficulties obtain when dealing with historic visitor numbers. As we’ve noted before, the Mapping Museums team is documenting UK museums from 1960 until the present day. Where available we have recorded visitor numbers that pertain to that period, and most notably, we have included figures from the massive DOMUS survey that was run between 1994 and 1998. This has the advantage of providing size indicators for museums that have now closed but we have discovered that some of the DOMUS records are anomalous. For example, The Royal Electrical and Mechanical Engineers museum is listed as having the following audiences in successive years.
4,500 in 1994
20,000 in 1995
35,000 in 1996
5,000 in 1997
According to these figures, the number of visits increased eightfold in a two year period, and then reverted to its original numbers. This seemed unlikely so we contacted the museum. The director, Major Rick Henderson, told us that the museum had never attracted such high visitor numbers. Even now, with a dedicated staff and a new building, attendances are in the region of 20,000. It is therefore likely that the inflated figures are due to errors made when the data was entered into the DOMUS system. The problem is that we cannot check all the anomalies, partly because of time but mainly because many of the museums have since closed and the institutional memory lost.
Thus, there are several challenges to using visitor numbers to give a sense of the scale of a museum: it is difficult to find figures for unaccredited museums or they may never have been collected; there is no established methodology for collecting visitor numbers; museums massage audience numbers for strategic purposes; and historic records may be incorrect.
The Mapping Museums team decided to deal with these various issues by using categories for size rather than visitor numbers. Providing precise numbers may give the false impression that the figures all adhere to the same measure and can be compared, whereas categories provider a looser guide to a museums operations. Unfortunately, using size categories also has its complications, which I will outline in the next blog.
The Mapping Museums project is coming to the end of its second year. To mark the half way point of the research, this blog provides a brief update on some of the work so far.
Finalising the data
Early this year, Dr Jamie Larkin, the researcher, completed the main phase of data collection. We are continuing to make changes to the dataset as new museums open and existing museums close, and we’re still trying to hunt down some missing opening and closing dates, so it remains work in progress. Nonetheless, we now have information on almost 4,000 museums that have been open at some point between 1960 and the present day.
Evaluating the knowledge base
Alongside data gathering, we have designed a knowledge base that allows users to browse, search, and visualise the data in nuanced and precise ways, and which we described in our last blog (See: Managing Patchy Data). As part of the design process, Professor Alex Poulovassilis, the co-investigator on the project, and Nick Larsson, the Computer Science researcher and developer of the knowledge base, organised a series of trials to evaluate the knowledge base. These provided us with valuable feedback and we responded by making changes to how the material is presented and navigated.
We got enormously positive responses at the most recent user trial in Manchester in July. Having lived and breathed the research for the last two years it was very encouraging to hear Emma Chaplin, director of the Association for Independent Museums, call it the “museums equivalent to YouTube” and say that she could while away hours browsing the material; to know that staff from Arts Council England thought that it was “intuitive to use”; and generally that the trial participants assessed it as a being a useful resource for them in their roles and for others in the sector.
Analysing and publishing the findings
Having finished the data collection and the main phase of developing the knowledge base, we have been able to start analysing the data. These initial analyses will be the basis of a series of articles, and over the summer, the team has been working on four publications:
‘Mapping Museums and managing patchy data’ examines the reasons why data on the museum sector is so incoherent, how the project sought to remedy that situation, in part by building a system that acknowledges uncertain information.
‘Where was the Museum Boom?’ looks at the massive expansion of museums in the late twentieth century and asks whether or not the boom took place across the UK, or if there were regional variations.
‘Creating a Knowledge Base to research the history of UK independent museums: a Rapid Prototyping approach’, covers the computer science research that underpins the conceptualisation and construction of the knowledge base.
‘Missing Museums’ deals with the recent history of museum surveys, considers the focus on professionalised museums, and asks what the sector looks like when we factor in unaccredited museums.
Brief versions of the first and second of these papers were also presented at conferences: Digital Humanities Congress at Sheffield University and Spatial Humanities at Lancaster University, both of which took place in September, and we hope that the full versions of all four articles will be published within the next academic year. We’ll let you know when that happens.
The process of analysing data has been greatly helped by having Dr Andrea Ballatore join the team early in 2018. Andrea is a Lecturer in GIS and Big Data Analytics in the Department of Geography at Birkbeck and he is leading the statistical analysis within the project. He has also made invaluable contribution to developing the knowledge base, particularly with respect to mapping the data.
There is a limit to how much information can be unearthed online or from an archive. Over the last year, the Mapping Museums research team has compiled a mammoth list of museums that were open in the UK between 1960 and 2020. We have used various sources to cross check their details, but there are some particulars that can be hard to find or verify. And so, we asked the Museum Development Network for their assistance.
The Museum Development Network consists of twelve groups, one apiece in Northern Ireland, Wales, and Scotland, and one in each of the nine regions of England. Although the groups all function slightly differently, they all support accredited museums, advise on the accreditation process, and provide relevant information to Arts Council England and other national organisations. They also allocate their own grants, run projects, and help improve services and their members’ skills. In doing so, the museum development officers quickly acquire a fine-grained knowledge of their local museums. We wanted to refine our data by tapping their expertise.
With the support of Claire Browne, the network chair, we arranged to visit staff in each country or region. On each occasion, we arrived with a list of the museums of that area and slowly worked our way through the data, line by line. We had asked the museum development officers to look out for any information that we may have missed and they pointed to a number of instances where the local authority had transferred responsibility for a museum to an independent trust. They also noticed some duplicate entries that had resulted when a museum’s name had been changed, and spotted instances when museums had moved premises, amalgamated with neighbouring venues, or had recently closed. We deleted or edited the entries as appropriate.
The Museum Development Network helped us fine-tune our data and they also contributed to our research by helping us classify museums according to their subject. In most cases, the main topic of a museum is fairly obvious: as one might expect, the Lapworth Museum of Geology concentrates on rocks of varying types, while the Bakelite Museum has a collections of plastic, but the theme of a museum is not always so self-evident. For example, Carnforth Station provided the set for Brief Encounter, and its Heritage Centre focuses on the film, not on railways or trains, while the Deaf Museum and Archive in Warrington is more concerned with the community than with health or medicine. Being familiar with these venues, the museum development officers could make a nuanced judgement as to their overarching subject matter, whereas the research team would have to spend a considerable length of time checking webpages, catalogues, and other sources to make a judgement. Their input saved us weeks of work. It was also good to establish that our new classification system worked smoothly, although the absence of a ‘social history’ category did cause some consternation. For us, the problem with ‘social history’ is that it applies to such a large number of venues that it lacks nuance. In the DOMUS survey, conducted in the 1990s, almost a third of museums were listed under this category, which makes it almost unusable for research purposes.
Holding the meetings served to further refine our data, and it also had benefits for the museum development network. Many of the officers said that they rarely got an opportunity to discuss the museums in their region, and that it was useful to do so. Others thought that going through the list was akin to a quiz on their museums, and had been fun. Almost everyone commented that the Mapping Museums team had identified numerous museums that they had never encountered, and that our data would inform their work, particularly with respect to unaccredited museums.
Ultimately, the experience was incredibly productive. It was a pleasure to meet such a dedicated and knowledgeable group of people. We are very much looking forward to the point when we can provide them, and others, with the completed data.
The Mapping Museums project aims to identify trends in the growth of independent museums from 1960 to 2020. In order to conduct our analysis we need to be able to interrogate longitudinal data for a number of museum variables, including years of opening and closure, size, and status change. At present, no such database exists that would allow us to do so. Ironically, for a sector committed to the preservation of cultural memory, documenting the institutions that participate in these activities is seemingly much less of a priority (see ‘Problems with the Data’ post). Thus, the first objective of the project was to create a functional database that catalogued all of the museums that have existed in the UK since 1960.
Before we began building this database we first considered the logistics of the process, namely the point during our timeframe when it would be best to begin to collect the data. Should we put together a snapshot of the nation’s museums as of 2016 (estimated at 2,500 at the outset of the project) and work backwards, or begin with a baseline of around 900 museums that existed in 1960 and work forwards? The former would give us a solid foundation but might require tortuous weaving back through name changes and amalgamations; the latter would give us fewer museums to start with, but might be easier as we attempted to record individual museum trajectories.
The solution was a compromise based on time and the availability of data. Between 1994 and 1999 the Museums and Galleries Commission ran a programme that produced the Digest of Museum Statistics (DOMUS). It involved annual reporting from museums that participated in the scheme in the form of lengthy postal surveys. The information captured included address, registration status, visitor numbers and many other characteristics. While some limitations with the data have been highlighted in retrospective analyses (specifically by Sara Selwood in 2001), the baseline data that DOMUS provided was sufficient for our needs.
Using this as a starting point enabled us to begin with detailed information on nearly 2,000 museums. This snapshot of the museum sector in the late 1990s provided us with the flexibility to work both forwards and backwards in time. In particular, having records of museums at an interstitial stage of their development has been helpful in tracking (often frequent) changes of name, status, location and amalgamations.
The major problem with the DOMUS survey was accessing the data and formatting it for our use. After the project was wound up in 1999 the mass of information it had generated was deposited at the National Archives. However, given the complex nature of the data, there was no way of hosting a functional (i.e. searchable) version of the database. Consequently, it was archived as a succession of data sheets – in a way, flat-packed, with instructions as to how the sheets related to one another.
The first task was to reassemble DOMUS from its constituent parts. This meant trying to interpret what the multiple layers of documents deposited in the archive actually referred to. While the archival notes helped, there was still a great deal of deductive work to do.
Once we had identified the datasheet with the greatest number of museums to use as our foundation, the next step was to matchup associated data types held in auxiliary sheets into one single Excel master sheet. To do so we used the internal DOMUS numbers (present within each document) to connect the various data to create single cell data lines for each individual museum. We slowly re-built the dataset in this way.
In some instances the splitting of the data – while presumably logical from an archival perspective – was frustrating from a practical standpoint. A particularly exasperating example was that museum addresses were stored in a separate sheet from their museum, and had to be reconnected using a unique numerical reference termed ADDRID. While the process was relatively straight-forward, there was always a degree of anxiety concerning the integrity of the data during the transfers, and so regular quality checks were carried out during the work.
The next step was to clean-up the reassembled sheet. Firstly, we removed anything from the data that was not a single museum (e.g. references to overarching bodies such as Science Museum Group). Second, we reviewed the amassed data columns to assess their usefulness and determine what could be cut and what should be retained. Thus, old data codes, fax numbers and company numbers were deleted, while any information that could potentially be of use, like membership of Area Museum Councils, was retained. We also ensured that the column headings, written in concise programming terminology, reverted back to more intelligible wording.
This formatting helped shape the data into a usable form, but the final step was to put our own mark on it. Thus we devised specific project codes for the museums, which was useful for recording the source of the data and managing it effectively moving forwards. To tag the museums we decided on a formula that indicated the project name, the original data source, and the museum’s number in that data source (e.g. mm.DOMUS.001). Once our database is finalised, each entry will be ascribed a unique, standardised survey code.
Ultimately, the DOMUS data has acted as the bedrock of our database. It provided a starting point of 1848 museums and thus the majority of our entries have their basis as DOMUS records (which have been updated where applicable). One of our initial achievements is that the DOMUS data is now re-usable in some form, and this may be an output of the project at a later date.
A wider lesson from this process is the importance not only of collecting data, but ensuring that it is documented in a way that allows researchers to easily access it in the future. When our data comes to be archived in the course of time, the detailed notes that we have kept about this process – of which this blog will form a part – aim to provide a useful guide so that our methods and outputs can be clearly understood. Hopefully this will allow the history of the sector that we are helping build to be used, revisited, and revised for years to come.